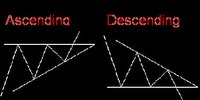
Triangles
 I gave a presentation in Master Talk a few weeks ago about Triangles. This will be a follow up to that presentation and hopefully answer a few lingering questions that are still out there on the topic. First off, let me define what a triangle is. A Triangle is a formation on a price chart that looks like a triangle, and triangles happen to be continuation patterns, meaning once they are confirmed, the stock should continue it's trend. Spotting a triangle means something depending on what kind of a trend you are in, and what kind of triangle you see. There are three types of triangles...
1. Ascending Triangles- This is a bullish continuation pattern. Ascending triangles should be found in uptrending stocks, which signals that once the pattern has confirmed, the bullish trend will continue.
2. Descending Triangles- This is a bearish continuation pattern. Descending triangles should be found in downtrending stocks, which signals that once the pattern has confirmed, the bearish trend will continue.
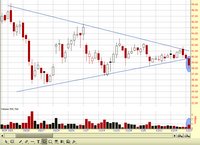
3. Symmetrical Triangles- This is a neutral continuation pattern. Symmetrical Triangles can be found in either uptrending or downtrending stocks. Once the stock has chosen a direction to break out in, the prior trend will continue.
 Three more things to discuss....
Confirmation- When I use the word confirmation, this is when the stock price CLOSES above or below a support or resistance level along with heavy volume (at least higher than average volume). Here is an example of a confirmation of a symmetrical triangle.
 Re-Tests- After a breakout, it is not uncommon to see the price rally back to the area it broke out of. Here is a another picture that shows the stock above after the initial breakout, rally back up to old support and use it as new resistance. This is called a re-test. Re-tests are great entry points if you missed the breakout. Volume is not as important on the re-test as it is on the breakout.
  Pattern Failure- After a breakout, if the price ever traces back within the body of the pattern before reaching a target, this is considered a failed pattern. Also, if the stock breaks out in the wrong direction this is a failed pattern as well. (Ex: If I am watching an ascending triangle and the stock breaks support instead of resistance.) If either scenario happens, I take the loss and move on. Here is an example of a failed pattern.

If you are feeling lost, I won't discuss advanced topics forever. If many of these recent posts are intimidating for where you are in your education, I will try and mix it up occasionally.


Jeff,
Ever since taking your price patterns class, triangles have been my absolute favorite pattern to spot on a chart.
For those of you unfamiliar with triangles, here's why i LOVE them, and why you should too:
1) There's very little decision-making involved. Spot the triangle, set your alerts and wait for the signal. If you get a break on volume, you're in.
2) Since you're watching for the break, you should almost ALWAYS get an ideal entry (unless the stock jumps out of the triangle due to news). This gives you a very low risk to high reward trade setup.
3) Triangles are measurable, so you know your minimum target and time frame in advance rather than just 'riding a trend'.
Everyone should be watching these. Here's a little 'fish' to throw to the group: CELG formed a double top breakdown 2 weeks ago which has consolidated into a 1-month descending triangle continuation pattern that broke support at the close today. Great risk/reward entry for a 1-month $6 move.
Jeff, your blog is PHENOMENAL. There's SO MUCH education on here. Thank you for all the time you put in to this.
Posted by Anonymous |
8/31/2006 03:33:00 PM
Great information Jeff and very helpful. Are there any searches that a person could run that turns these patterns up.
John V.
Posted by Anonymous |
8/31/2006 03:35:00 PM
Keep it coming. Everyday I feel a little smarter after reading your blog. Thank you, Thank you....Sarah
Posted by Anonymous |
8/31/2006 03:40:00 PM
Brett,
Awesome follow up. I forgot to talk about application, but you summed it up nicely. These kind of "help" posts are so helpful to others, thanks!
Posted by Option Addict |
8/31/2006 03:48:00 PM