All good traders need to have a routine that they follow. Have you created your daily/weekly routine yet? Have you chiseled down to a 20 minute per day workout? Is that even possible?
Let's talk about what a routine should address. Here are the main objectives:
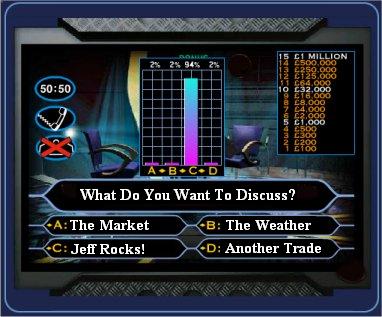
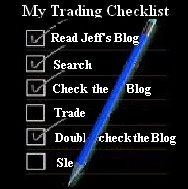 Market Analysis
Find new trades
Manage existing trades
Lunch
Update/Purge List
Revisit Stops & Position Size
Market Review
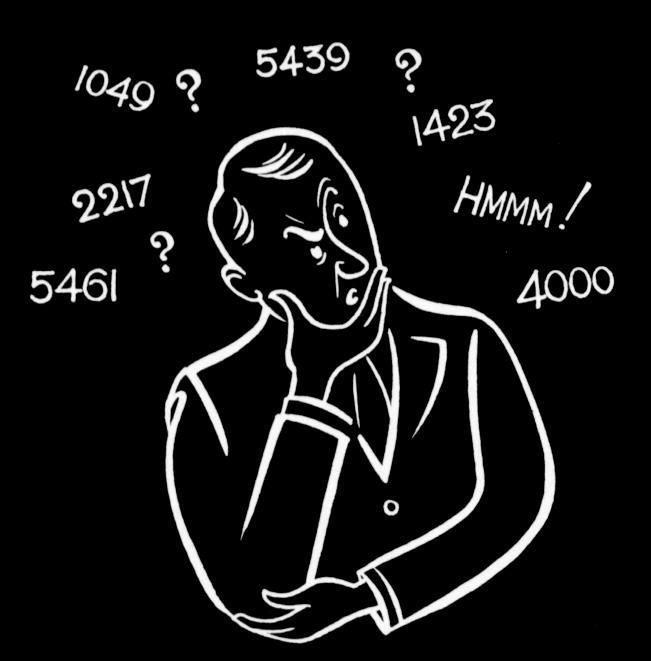
I am sure most of you already have a certain outline you follow each day, but are you efficient with it? Are you spending more time than you need to? Some spend hours per day, which is fine if you are willing, but I spend very little time in my actual routine, the rest of the time is just watching the market.
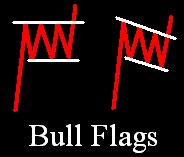
Let me give you an outline of what my week looks like. Monday morning I stagger into work for an a.m. presentation. Before I begin I read the headlines of what will affect the market today as well as take a look at futures pricing to get an idea of how the market will open and how bull/bear things look. After I get my feel for market direction, I search. I look through my watchlist (which contains around 1700-1800 stocks) to find patterns. Before you send an e-mail asking about why I watch so many, what kind of stocks are they, etc... let me explain that they are totally random stocks, and I watch this many just to look for patterns (triangles, flags, pennants, etc). I like being able to look at thumbnails (lots of them) since I can get through them quickly. As a short term trader, most of you know I can care less about the fundamentals, industry groups, etc since I am so short term minded.
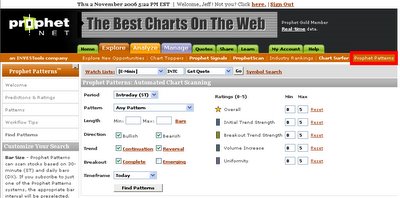
Back to the routine, I search through these lists which takes about 25 minutes. I write down the symbols that contain potential patterns to watch for breakouts. Since these stocks could take forever to break out, I go run a few of my favorite searches to find things to trade asap. Here are the searches I run...
Anticipating the Bounce
Bullish trending stocks that might be bouncing off support
Anticipating the Bounce II
Bearish trending stocks that might be bouncing off resistance
Downtrending Stocks with a High MACD
Bearish trending stocks that might be bouncing off resistance
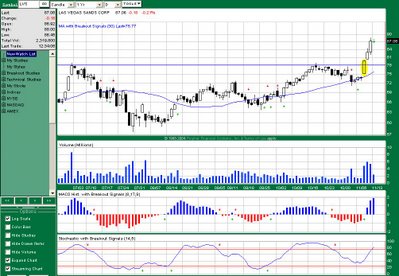
Searching for a Bullish Breakout
Bullish trending stocks that might be breaking out into new highs
This is where I generate most of my trades for the week. The list of patterns I found from my watchlist are the ones I actually "watch" for breakouts and trade those as soon as I get the signals.
When the market opens, I watch my existing positions to see what their reaction is. Mostly out of curiosity since I don't place very many trades until the market is nearing the closing bell. I can see what the movements are to check exits and revise my positions if need be.
If I see any opportunities after the open that I need to be a part of, I will enter them as I see fit, but after this, all is quiet until after lunch. I have everything up on the computer, but I just watch the tides roll in and out until later in the day.
Lunch comes next. I would normally talk in lengthy and specific detail on this topic alone for all those who submitted on my poll that they would prefer to read less of my personal stuff (such as lunch), and just get more trades. However, since I have plenty of things to do today, I will reserve the effort.
As the end of the day rolls around, 2:30 - 4:00 Eastern specifically, this is when I am pretty busy. Having watched the tides over and over throughout the day, I am like Tom Hanks in the movie Cast Away....just waiting for the right wave and I take the trade. I get into everything I am going to get into for the day, close any positions that need a close, and watch the market go to sleep.
After the close, I will review the news, price action, or anything that might cause the ship to steer off course. I revisit all my exits to see what I need to pay attention to, or movements that need to have an exit tightened to lock in a few profits. If I do tighten up any exits, this is when I normally add to a position and buy more contracts while still risking the proper position size.
This is what the routine will look like for each day of the week. The watchlists only get reviewed once a week, and searches might only be run once, maybe twice a week depending on how many trades I am watching. As the week goes on, I am also subtracting stocks off my list for breakouts. Many will fail before giving a signal, so these get crossed off when applicable.
That is what my routine looks like. It does not take a whole lot of time, and for me it feels very efficient. It offers plenty of time to walk away for extended periods of time, answer e-mails, post to this blog, etc. I had a few questions on this topic over the weekend, so here is a look at how I get things done. I will be back in a while.
 Post feed
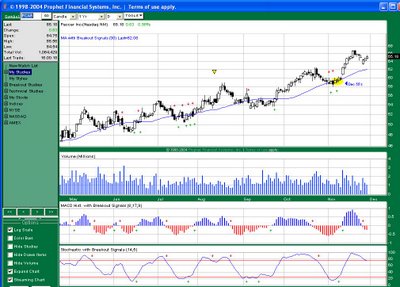


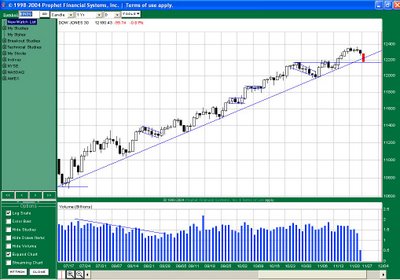


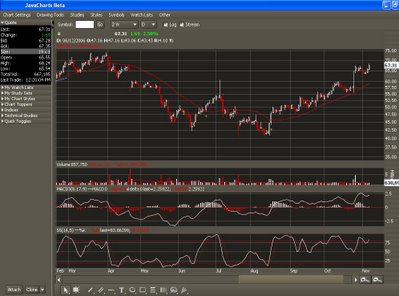
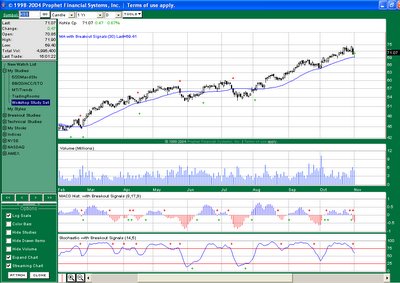
 Look at the chart below, and what is the best trade to make on this one. The stock is catching on fire and what trade could you place to take advantage of it? Yes, there are expensive options here...yes, it has moved a lot already, so what would you do if you had to trade it?
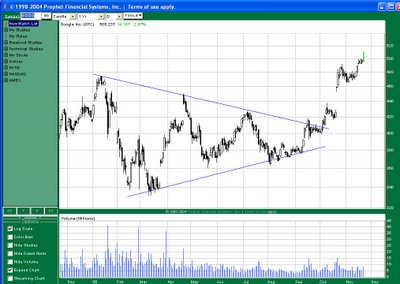


 If you missed last nights presentation, I conducted a trader interview with Eric


