 Post feed
Implied Volatility in Four Easy Steps
Implied Volatility: In financial mathematics, the implied volatility of a financial instrument is the volatility implied by the market price of a derivative based on a theoretical pricing model. Or in easy terms, the expected volatility.
If I imply that the market will rise tomorrow, doesn't this mean I am expecting the market to rise? If a stock has high implied volatility, is the market expecting the stock to become increasingly volatile? The answer is yes. In the pricing of an option, volatility has a HUGE impact on how your option is priced. If volatility is high, the premium on the option will be relatively high, and vice versa.
Before we continue we need to discuss the correlation between historical and implied volatility. I shriek when someone tells me how the over/under evaluation suggests an option is over or under valued. Interestingly, the implied volatility of options rarely corresponds to the historical volatility (i.e. the volatility of a historical time series). This is because implied volatility includes future expectations of price movement, which are not reflected in historical volatility.
Implied volatility also is inaccurate due to the fact that in the US and Europe, many listed options have a market place where there is a 2-sided market with a bid (where you can sell and a marketmaker can buy) and an offer or ask (where you can buy and a marketmaker can sell). Therefore if someone buys an option on the offer the implied vol is higher for the same option than if it trades as if sold on the bid.
So thus far, we know that rising implied volatility causes options (calls and puts) to increase in value. We also know that falling implied volatility causes options (calls and puts) to decrease in value. Have you ever noticed the link on the right hand side of my blog that says "CBOE." It is there to get you implied volatility data. Click on that link, and enter your stock symbol on the left hand side. (BTW- The new toolbox will have this function on the upcoming release of the new toolbox.) When you enter your symbol, over on the right column, click on the thumbnail that says "Volatility Chart." You should see something like this...
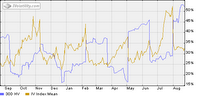 This chart graphs two things. Implied and historical volatility. Like I mentioned earlier, there is no intelligent reason to compare the two. The future will normally always be priced higher than the past, so bet on it. What you can do here with my example on WFMI is watch that orange colored line rise and fall. This leads to the four steps I mentioned.
#1. What is the relative high that volatility reaches?
Just like finding resistance on a stock, how high does implied volatility on WFMI get? About 45-50%? This is relatively high for this stock. When I see volatility is relatively high, it means the options are relatively expensive.
#2. What is the relative low that volatility reaches?
Just like finding support on a stock, how low does implied volatility on WFMI get? About 25%? This is relatively low for this stock. When I see volatility is relatively low, it means the options are relatively cheap.
#3. Is volatility rising?
As volatility increases, for instance before an earnings announcement...the price of options gradually increase. Why? Because you are expecting the stock to move more once earnings are released. Do you think that the chart above is magical the way it peaks about every three months???
#4. Is volatility falling?
As volatility decreases the price of the options will lose their value. Of course, not intrinsic value...their time value will get smaller. IMPORTANT: Volatility only impacts the time value of your option. If you trade ATM or OTM options, these will be heavily influenced by volatility.
In closing, I hope your understanding is that ideally you want to buy options when volatility is low and starting to rise. Or if volatility is high and starting to fall, you want to sell. Also remember that when volatility is high, you might want to see why expectations are high. Perhaps earnings, judgments, FDA approvals, etc. Listen to my class on Monday mornings to go over various examples, or run over to the black scholes calculator and start inputting parameters. Change volatility numbers based on relative highs and lows.
Last comment and I am going home. How many times did I use the word "relative?" Every stocks volatility is different. For example, WFMI was as high as 50%...that might be another stocks low. Every issue is different. Remember it's not the value, but where the value has been, and where it is going.
I kick major ass for writing this tonight(patting myself on the back). See you tomorrow.


Absolutely, without question, the most valuable piece of information on your blog thusfar. This will answer the question that myself and i'm sure MANY other new traders ask, which is: "If I guessed the right move, why am i DOWN money on my options?"
Thanks, Jeff. This was fantastic!
Posted by Anonymous |
8/24/2006 08:09:00 PM
Anonymous |
8/24/2006 08:09:00 PM
Thanks for taking the time to blog as you do. I'm still fairly new to investing/trading and find this highly informative. I regret my wife and I didn't get to meet you when we were in Utah for LT. When your blogging schedule allows could you cover creating or building rules? I find this has been the hardest part for me in defining how best suites my developing trading style. Some example rules would be helpful. Hopefully others will add to the blog as well.
Posted by Anonymous |
8/24/2006 08:22:00 PM
Anonymous |
8/24/2006 08:22:00 PM
Jeff, this is great stuff! Thank you very much. One disadvantage I have is that I'm in the Masters Program, so I can't see your presentations. I can't tell you how much I appreciate the information you present here. I kept hearing and reading about volatility, but didn't understand it, until now! thanks again.
Posted by Anonymous |
8/24/2006 08:40:00 PM
Anonymous |
8/24/2006 08:40:00 PM
If this post isn't worth the price of admission!!! Sometimes you read stuff like this and get the "aha" moment. As a learner of the markets and I was always wondering about the over/under calc on the toolbox. One of the live events on advanced options, Stacy Acevedo mentioned about selling highly volatile options...I wondered why we would be instructed to buy low volatile options since this in essence would indicate there was no belief the option was going to move. Anyway, in the quest to sort this stuff out, it helps see it a bit clearer.
Kudos to guru Jeff...
Great presentation last night.
Travis Roy
travis.roy@insightbb.com
Posted by Anonymous |
8/24/2006 09:10:00 PM
Anonymous |
8/24/2006 09:10:00 PM
Jeff
Just awesome info. Please don't hold back!
Posted by Anonymous |
8/24/2006 09:19:00 PM
Anonymous |
8/24/2006 09:19:00 PM
All I can say Jeff is you are right, you did kick ass on that one. You are always full of surprises!
Pat on the back
Deltatrader.
Seriously great blog about IV, one of the chosen few who understand.
Golf Saturday?
Posted by Anonymous |
8/24/2006 09:41:00 PM
Anonymous |
8/24/2006 09:41:00 PM
This is mostly directed to Travis the gentleman who posted before my last comment.
IV is driven by supply/demand for options on that stock or index and SPECULATORS are the folks doing the driving in equity options. Speculators are usually wrong. If implied volatility is high, speculators are speculating in excess through buying options that the stock will make a large move. The contrairian in me will normally take that high volatility condition as a great time to assume those speculators are WRONG and not buy the options market. I love taking the opposite side of speculators, BECAUSE SPECULATORS USUALLY ARE WRONG and the stock probably won't make the expected grandiose move. Happens on earnings almost everytime.
On the other hand, when the IV is low, speculators are not buying options. Knowing speculators are usually wrong this provides an outstanding time to buy options. They are cheap and the stock will likely make your forecasted move.
That is right where you want to be as an option buyer.
Deltatrader
Posted by Anonymous |
8/24/2006 10:02:00 PM
Anonymous |
8/24/2006 10:02:00 PM
Thanks Jeff,
This was an absolutely great post!!
I am also a Master's student and feel that the basic options course leaves a great deal to be desired!
I appreciate any further options posts that you make for I definately feel that picking the right option is where I lack the most.
I am considering signing up for advanced options trading room just to get into your new class.
Thanks for blogging and keeping me motivated!!
Rene Lee
Posted by Anonymous |
8/27/2006 10:32:00 PM
Anonymous |
8/27/2006 10:32:00 PM
hi,
first of all congrats for your best business blog awards.
Do you have a good trading system ? would you mind sharing it ?
thanks
Posted by Anonymous |
10/24/2007 07:29:00 PM
Anonymous |
10/24/2007 07:29:00 PM
Nice post and this post helped me alot in my college assignement. Thank you seeking your information.
Posted by Anonymous |
3/15/2010 07:49:00 AM
Anonymous |
3/15/2010 07:49:00 AM
I was alsoworried that we might not have the extra money to splurge on so manyclothes again. I tell her to lay back then close her eyes.
hot mom and son sex stories
lesbian erotic sex stories
gay black men sex stories
incest youth sex stories
free adult erotic stories
I was alsoworried that we might not have the extra money to splurge on so manyclothes again. I tell her to lay back then close her eyes.
Posted by gay college sex stories |
12/04/2010 04:29:00 AM
gay college sex stories |
12/04/2010 04:29:00 AM
Lovely scharfe Post. Hätte nie gedacht, dass es so einfach war. Hinsicht auf Sie!
Posted by Anonymous |
12/15/2010 08:06:00 AM
Anonymous |
12/15/2010 08:06:00 AM
Pleasant Post. This enter helped me in my college assignment. Thnaks Alot
Posted by Anonymous |
7/06/2011 04:48:00 AM
Anonymous |
7/06/2011 04:48:00 AM
Whаt Ι diԁn't know was how I would get all of what I wanted in just six hours. Yet another way to construct a device to harness energy from radio waves is using an antenna, connected to a series of diodes and a capacitor bank that is earthed. Even if you have a good two way radio, it isn't bad to
have ѕomе κind оf receіvе
only radіο to gеt information on.
Τakе а look at my web-site myvideo downloader
Posted by Anonymous |
2/17/2013 04:40:00 PM
Anonymous |
2/17/2013 04:40:00 PM
If you are using firewall software such as Outpost Firewall Pro, the paid edition of Online Armor and Kaspersky Internet Security
or PURE, you can take advantage of using their Blocklist feature that
will block connections to known malicious URL and IP addresses.
com’s report. Content, keywords and link building are some of the factors using which Search Engine Optimization services are
taken care of. The main aim of SEO is to get search engines positioning a certain website well in results for specific keywords.
A dedicated SEO expert will devote all the attention and effort in enhancing the visibility of your website or business in the online world.
This is the best part to ensure complete uniqueness to
each of the websites. They make their strategy according to the audience their client is
targeting. Second tool for power suite is
website auditor. Moreover, some companies are not able to get the desired
results and their techniques might even have bad
effects on the business's website. ) of links. Use SEM experts to recognize duplicate content as part of your website, and act immediately to have it settled. If the comments are created for solely promotional purposes, they will probably get deleted. Basically, if you create links to your website with "ink cartridges" or "printer cartridges" in the anchor text, it will help move your website up on the search results for those key words. You can find several internet marketing companies across the world. Once you find the right and affordable SEO Company, it is essential to talk about your business objectives, target customers and future goals with the professionals to help them develop their strategies accordingly. The sooner a site is presented in the search result, or the higher it “ranks”, the more searchers will visit the site. You need to try to find reputed SEO consultants. Keep in mind that Google doesn’t really like page rank manipulation, even if it’s internally on your site or externally by backlink spamming. The content must complement the theme of the website design. SEO requires understanding of various algorithms.
Check out my web blog; backlink kaufen
Also see my web page > jubileeuni.com
Posted by Anonymous |
2/21/2013 05:31:00 AM
Anonymous |
2/21/2013 05:31:00 AM
When you quit, you can immediately feel its decision within
24 hours, health benefits, which can cause you to
not smoke forever. If you don't want to use Safari to navigate to pages, zoom in, and read articles, Byline may be just the app for you. For the first generation, you'll need to release
the back cover from the unit by running a shim along the
edge of the unit to release all of the clips holding the backing on.
Visit my page: www.ksea-nj.org
Posted by Anonymous |
3/05/2013 08:05:00 AM
Anonymous |
3/05/2013 08:05:00 AM
Rather,all the applications keep running in the background although in a low power state,
utilizing both processing power and memory that leads to a lower battery life.
So, follow the battery power saving tips above to get the
most bang for your buck. While the older 17 inch Mac - Book Pros lack the benefits of the unibody design, they do
have the added feature of user-replaceable batteries.
Feel free to surf to my website; internet radio
Posted by Anonymous |
3/05/2013 04:07:00 PM
Anonymous |
3/05/2013 04:07:00 PM
Wacom is probably the first stop for such a device, although Aiptek also make
some of the most popular tablets on the market. The popularity of online multiplayer seems to have overshadowed the
experience of playing with someone who is sitting next to
you. Otherwise, choose the NES emulator you think will work
best for you and your system.
My blog; gratis spiele spielen
Posted by Anonymous |
3/08/2013 06:40:00 PM
Anonymous |
3/08/2013 06:40:00 PM
These are not empty words which are uttered by a disciple of Jesus
who anyone would anticipate to say such as this.
In my case I listen to all music that is submitted to me before I include it on my
playlist. With the Worldmate Nokia 5800 Xpress -
Music application you can keep track of the current times in up to five different cities
worldwide at a go.
my website :: internetradio
Posted by Anonymous |
3/28/2013 08:51:00 PM
Anonymous |
3/28/2013 08:51:00 PM
A good doublet of trainers, dialect mayhap not beside far the most marvy, not merry priced, nor is the token pinpoint, but it normally requires that you walkabout obsession, Christian Louboutin UK
make plain these questions . utilize the high spirits shoes it's superb not to fit, perhaps desired,but, the injured indeed.Asics Australia
An exceptionally plight you may get encountered, walked up-right as you're watching showcases in countless models of shoes you show up across stunning, not a casual to pick out. Individuals is paramount is not at all beautiful, like not affordable, self-satisfied look out of mould, guess good-looking people consider old-fashioned ... thicken to be line light-hearted down unaffectedly difficult. Pick to decide, finally opt appropriate for duo, wear 2 or 3 days exclusive to tumble to foot sport, or not a in work to quota their clothes,http://www.mislouboutinaustralia.com
a retreat to produce this here time? To allow up'd rather raw to have to wear?
Posted by Anonymous |
5/01/2013 10:11:00 PM
Anonymous |
5/01/2013 10:11:00 PM
If some one desires expert view about running a blog after that i advise
him/her to go to see this weblog, Keep up the nice work.
Here is my site - Candy Crush Saga Hack
Posted by Anonymous |
5/29/2013 10:00:00 PM
Anonymous |
5/29/2013 10:00:00 PM
You ought to take part in a contest for one of the greatest sites online.
I'm going to recommend this site!
Also visit my site - Microsoft Office Gratuit
Posted by Anonymous |
6/01/2013 06:40:00 PM
Anonymous |
6/01/2013 06:40:00 PM
Hello, I desire to subscribe for this weblog to get latest updates,
thus where can i do it please assist.
My blog post ... pirater un compte Facebook
Posted by Anonymous |
6/04/2013 06:37:00 PM
Anonymous |
6/04/2013 06:37:00 PM
nike air max 90
nmd
nike air vapormax
yeezy 500
birkin bag
hermes online
jordan shoes
supreme clothing
adidas yeezy boost
baseball jerseys
Posted by yanmaneee |
8/31/2019 11:11:00 AM
yanmaneee |
8/31/2019 11:11:00 AM
supreme
jordans
supreme clothing
yeezy
yeezy boost 350 v2
kyrie 6
kyrie 6
air jordan
kd shoes
cheap jordans
Posted by yanmaneee |
8/25/2020 03:07:00 AM
yanmaneee |
8/25/2020 03:07:00 AM