Moving Averages are Worthless
 A moving average is an indicator frequently used in technical analysis showing the average value of a securities price over a set period. Moving averages are commonly used to generalize a trend and define areas of possible support and resistance. Using moving averages can be useful, but I say this assuming they are being used properly. All too often I hear way too much emphasis being placed on moving averages. I am creating a list of "The 5 common misconceptions of moving averages." I will try to comment on each of these concerns I have in order to better understand proper use of moving averages.
1. A moving average is confused with the word "Trend."
Too often the direction of the moving average is assumed to tell us the trend of the stock. Make sure that this is not the case. Price movements will define the trend of a stock. We try to have people focus on higher "highs" and higher "lows" to define an uptrend, and vice-versa for a downtrend. This thought process will override the direction the moving average is traveling. Do realize that price and a moving average can be moving in different directions, so emphasize price first.
2. A moving average is assumed to magically act as support
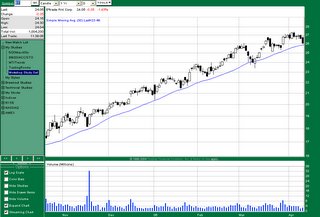
Have you ever done this? The price happens to be on the moving average, and we automatically assume it will bounce. A moving average can act as support, but there needs to be evidence that this is the case. If I look at the chart and see historically that the stock has bounced off my moving average as support and going back I am convinced of its repetition, then feel free to assume. Look at this chart below as an example. Would you expect the stock to bounce or break?

3. A moving average is assumed to magically act as resistance
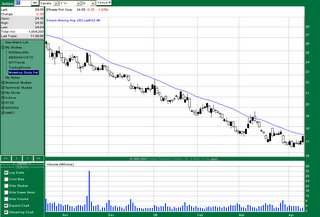
A moving average can act as resistance, but there needs to be evidence that this is the case. If I look at the chart and see historically that the stock has bounced down from my moving average as resistance and going back far enough I am convinced of its repetition, then I will assume this pattern will continue. Look at this chart below as an example. Would you expect the stock to bounce or break?

4. A stock being above a moving average is relevant
If your stock is not in a steep angles trend, there will be times where it is above the moving average, and there will be times when it is below the moving average. Question: Does this matter? In my opinion, No it doesn't. If you were thinking this was important, this might go back to the assumption that a moving is support, and we need to wait until it crosses above this average in order to buy. Try this instead...Draw a support line, and as long as the stock is bouncing off this level, no matter if the stock is above or below the average, it would still be good for a trade.
5. A stock being below a moving average is relevant
See above.
Now that I have brought this out into the open, my intention was to make sure I could clear up any confusion on how to use this tool and counter offer a few ways it might be useful. In my opinion, the best way to use moving averages is to create a system of when to buy and when to sell. I used to trade moving average crossovers. I would take a short term moving average and a longer term moving average and when they crossed, this would tell me to buy or sell. Obviously this will work best in trending stocks, and not so well in flat trending stocks. Normally I don't discuss trading systems, but the old method I used was pretty popular and not something I created on my own merit. I used a 5 day simple moving average combined with a 20 day simple moving average. When the 5 day crossed above the 20 I would buy, when it crossed below the 20 I would sell. Pretty simple, and very mechanical. The nice thing about mechanical trading systems is that they require no effort from us, and take our discretion out of the equation. The only discretion we have is the stocks we trade it with. Give this a try and see what you think...but please don't over-do it!!!


Jeff,
I have found a moving average to be particularly helpful on many retests for some breakout stocks. For example, sometimes a stock will break out of a pattern, retest, and actually go BELOW the pattern break line. Then, magically, the stock will hit the 30-day MA and continue the downtrend.
This happened to me this AM on CTX. It retested the neckline, FAILED it yesterday and then bounced off the 30-day MA to continue the breakout.
This also got me out of FTI and a few trades in BA.
Knowing this fact can keep you in some winning trades where the 30-day MA is NEAR the breakout point.
Posted by Anonymous |
9/22/2006 11:46:00 AM
Aloha Jeff
Based on your comment on the MA Crossover, you indicated you use to use the method. Do you not any longer? And if not, why?
john kevan
Posted by Anonymous |
9/22/2006 01:46:00 PM
John
I think the answer lies in point #4 wheer Jeff writes: "Try this instead...Draw a support line, and as long as the stock is bouncing off this level, no matter if the stock is above or below the average, it would still be good for a trade."
Is this correct Jeff?
Vinay Gaitonde
Posted by Anonymous |
9/22/2006 01:53:00 PM
I am glad you brought this up. I find myself not focussing MA as much as I did when I started trading.
In fact I tend to remove MAs altogether from the price action and draw my own trend lines. Drawing my own trend lines allows me to examine the the validity of a trend over the long and short term.
John
Posted by Anonymous |
9/22/2006 08:26:00 PM
Jeff,
You make some very good points here. We the beginners tend to start thinking of the MA as this support/resistance. Instead like you mentioned we should draw our own support and resistance and may be then use MA to confirm them.
Mahmood
Posted by Anonymous |
9/22/2006 08:54:00 PM
I don't necessarily disagree but isn't this thinking pretty contrary to Investools?
Posted by Anonymous |
9/23/2006 06:27:00 PM
This post is in response to the anonymous comment...
What I have written about moving averages is INVESTools doctrine. You may have misunderstood what INVESTools teaches about moving averages. This is why I created this post. To walk you through how to use them. A moving average MAY act as support & resistance, and it MAY reflect a trend, but many stocks don't, and this is where new students get confused. This article I wrote was intended for you. Now you know the common sense side to using moving averages. As soon as it sinks in, you'll thank me for the clarification.
Posted by Option Addict |
9/23/2006 10:02:00 PM
Hey Jeff and all,
I had removed the MA from most of my studies but found that often, when a price did not seem to complete a pattern as anticipated, that the MA was acting as support or resistance- if only in the very short term. I have started adding it back to some studies, although it does add a lot of clutter, just to be aware of its presence, but not necessarily to expect a bounce.
Is the addage "never enter a call below the MA and never enter a put above the MA" a sound rule? This is another reason I have added it back. To avoid breaking this rule. Does anyone else follow this rule?
Mark P
Posted by Anonymous |
9/24/2006 08:40:00 PM
Mark P,
If you trade by that rule, than this post was intended for your eyes also. Like I mentioned before, a moving average MIGHT act as support or resistance, but MOST of the time it does not. When you mentioned "never enter a call below the MA and never enter a put above the MA" why would this be a good rule to follow? Confirmation? Support is supposed to offer confirmation, not moving averages.
Posted by Option Addict |
9/25/2006 07:04:00 AM