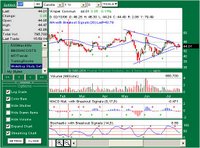
Stock: GOOG
Trend: Symmetrical Triangle reversal
Target: ???
Trade: OTM puts....Aug 350's perhaps? If it remains above it's 200 day, perhaps calls?
Why: Why is volatility increasing AFTER an earnings announcement? Have you seen this monster triangle pattern that is forming, or should I say that has finally broken. I'm not going to aim for an unrealistic target price, but there should be some residual continuation to catch as the stock falls. If you are not so sure, wait for a re-test! After all, there is a little hesitation as it attempts to break it's 200 day average.

Stock: VIP
Trend: Symmetrical Triangle Pattern
Target: $13 move upon a breakout
Trade: OTM calls or put depending on which way it breaks
Why: The pattern looks too pretty to ignore. This stock has amazing fundamentals and an awesome PE...Did I say that out loud?

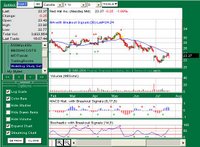
Stock: RHAT
Trend: Downtrend, resistance bounce
Target: $20ish
Trade: Aug $22.50's @ $.70
Why: Nice risk reward if the stock makes a lower low.

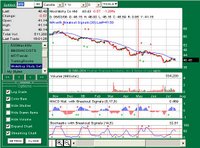
Stock: MNI
Trend: Downtrend, resistance bounce
Target: $36ish
Trade: Aug $40's @ $1.00
Why: I normally don't trade ATM, but if this stock makes my predicted move, this option is too cheap to pass on.
Other considerations: I closed out of LVS for a nice loss today. It triggered a mental stop as it plowed through support. I will give GRMN until Monday to get right, and if not Im closing it also. LRCX is still doing well and still on it's way to our target. Also keep an eye on BBI as it continues to work that lovely channel, watch OIH to stay above $130 for a nice bounce, and BA in case it breaks support.
I have a feeling the market will rally next week....
Until then, have a coke and a smile!


