FAST Response

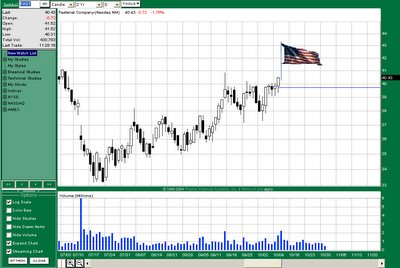
I see a price pattern on this chart. One that is referred to as a "Flag." A flag should consist of two components.
- First: There should be a price movement that resembles a flagpole.
- Second: There should be price action that resembles a flag.
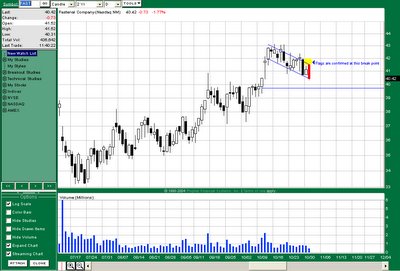
In essence, when you see this type of price movement on a chart, it should visually look like a flag. Here is a snapshot of the actual chart. Compare the two and see if you can spot any resemblance.

As you analyze this chart, notice the breakout above $40 which occurred a few weeks ago. The stock almost ran straight up to $43. This price action is going to be our "flagpole." From the top of this flag over the course of the next two weeks this price action represents the "flag." I have drawn trendlines around it to help create the visual effect needed to see it.
Let's talk about what a flag is. A flag is a continuation pattern. This one here represents a "bull flag." These are found in uptrending stocks, and it represents a consolidation before the stock resumes it's bullish trend. I use the word "represents" since this is not actually a bull flag yet. In fact a pattern is never a pattern until it has been confirmed. For this to confirm this formation, we need it to close above the resistance line I drew to start working towards its target price.
Yes, I said target price. You can actually measure these patterns to determine how much the stock will move in price. This is why price pattern trading is so popular. Each pattern carries with it predictive value, meaning if confirmed, you should know exactly where the price is going, and how long it will take to get there. Interesting huh?
Once FAST breaks this resistance line, it should move a minimum of $3.50. Depending on which option you purchase, set a stop so that you are not risking more than 1 or 2 percent of that $25k.
Example: 2% of $25k = $500. That is the most you can lose on this trade. If the options I want to purchase cost $2.50... I can buy two risking the entire premium, I can purchase 4 risking half the premium, or I can find a creative equation to make sure that if push comes to shove, I am out of this trade with only a $500 loss.
If I size this way, it would take a losing streak of 50 trades to wipe me out. Not going to happen, right?
Keep an eye on FAST for a confirmed breakout!


Jeff
What do you make of the bearish engulfing pattern that is forming???
Bagels
Posted by Anonymous |
10/31/2006 10:53:00 AM
As long as it stays within support and resistance, I usually don't notice it.
Stay Tuned!
Posted by Option Addict |
10/31/2006 11:12:00 AM
do i see the same pattern in ROST with less volatility in the flag?
Brian K
Posted by Anonymous |
10/31/2006 12:16:00 PM
Jeff,
Hard to see in the picture, could you tell me where you have drawn the resistance line?
thanks
raaj
Posted by Anonymous |
10/31/2006 01:08:00 PM
Hi Jeff....wow...what amazing action during the last 45 minutes of trading. I imagine that this is a good bullish sign after being down all day. I was disappointed to see it pull back in the last 15 minutes...but could this be a good sign for the bounce? Can you add commentary to that?
Chuck
Orlando, FL
Posted by Anonymous |
10/31/2006 02:51:00 PM
Jeff,
Great teaching tool. Your dedication to helping others learn about trading is greatly appreciated. A question about flag poles... at what point is an uptrend considered a flagpole? For instance LVS move from 10/4 to 10/17... can this be considered a flagpole?
Thanks
Danny
Posted by Anonymous |
11/01/2006 05:13:00 AM
For another beautiful bull flag in the making take a look at KO (Coke).
Strong upward move, followed by uniform pull back on decreasing volume.
"Its the real thing...?"
Looks like a $3.75 move if it breaks.
Mike H
Posted by Mike |
11/01/2006 10:57:00 AM