 Post feed
Bollinger Bands
As mentioned earlier, Bollinger Bands contract during low levels of volatility. It is believed that volatility will cycle just like the markets do. After a surge of volatility, we would expect volatility to die down. After the low volatility cycle, we would anticipate volatility to ramp up again. A “Squeeze Play” is when you find a Bollinger Band channel that is at a significant low (at least a 6 month low) indicating volatility is at a significant pause in it's cycle. The stocks found would then be analyzed in anticipation of a breakout. However, please use caution in your analysis. It is recommended that you also use RSI or some other oscillator to help confirm direction of the stock movement.
Check out this chart below on OMG. Since Bollinger Bands are a trending indicator, I have taken a trending stock to apply them to. I have also drawn a series of ovals. The light blue colored ovals indicate the width of the channel at a significant relative low. The orange colored ovals indicate when the stock had punched through these channels....I will get to these in a moment.
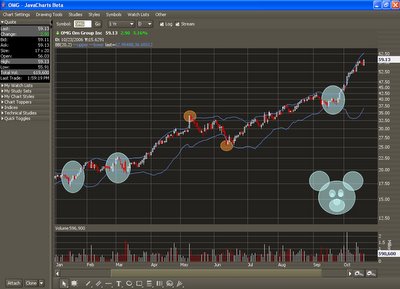
If you look at these squeezes, you can see the result is a nice pop in the stock which sparks a trend. After this trend, you can see volatility die down again, and then pop again. Like I mentioned earlier volatility will cycle. I built a search in the toolbox that is called "The Notorious Squeeze Play" found in the momentum archives of the strategy searches. It has helped to locate stocks in a relatively narrow bandwidth. Once the stock has confirmed a break of this narrow channel, you try to take a trade in the direction of the prevailing trend.
Another method of using these...one that I traded myself, is at these points where a stock has broken it's band. Take a look at the points highlighted in orange. Since two standard deviations will corral 95% of the price movements, 5% of the time the stock travels outside it's own statistical pathways. During these times of movements of improbable distances, notice how the price tends to travel back into the channel. I used to take these trades, but I was using 3 deviations rather than 2. That would give me a higher probability (in my eyes) that the stock would retrace. It might be worth some backtesting if you find it interesting.
Notice how I did not discuss the bouncing off upper channel to lower channel. I don't find results that are very consistent with this method. So officially I will not be taking any questions on it :) Use support and resistance instead.
Hope this post was insightful. If you have no interest in Bollinger Bands, tune in later today as I discuss something extremely important....such as reality television, things that piss me off, or additional wildly random topics.


So when the price breaks through the upper or lower band do you usually wait until you get a confirmation that its coming back to the channel? Is Volume important when taking the trade?
Danny
Posted by Anonymous |
10/19/2006 05:52:00 PM
Anonymous |
10/19/2006 05:52:00 PM
bollinger bands are far from wildly random - - but reality television...now that would just be awesome!
haha. what IS the answer to the comment above?
Posted by Anonymous |
10/23/2006 01:54:00 AM
Anonymous |
10/23/2006 01:54:00 AM