100,000 Hits? You must be joking...
 I looked at my hit counter today, and it looks like this blog has surpassed the 100,000 hit mark over the weekend. That is HUGE! Thank you to all of you for making this a site that you check regularly.
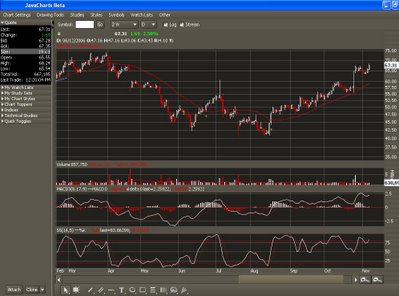
Sorry this took forever. I have been having computer problems today. Submit your analysis on whether or not you would trade this and why.


From a distance, it looks like a breakout of a bullish flag pattern. Volume looks to be average, but I can't see all the details in the chart. I would take this trade and set a stop just under the breakout and a target the length of the long flag pole a few weeks ago. What is the stock...looks good. Maybe it will retest the support???
Amy
Posted by Amy |
11/07/2006 12:59:00 PM
Sorry...blogger sucks. In the past you could click on the chart and blow it up. Since that is not working, pull up FFIV on the toolbox and give me your take.
Posted by Option Addict |
11/07/2006 01:01:00 PM
I also see this as a Bull Flag breakout. The volume increased a bit, but is still weak for a breakout, so it is a lower probability trade. However, I liked the potential reward, so I entered a trade on this today.
Posted by Anonymous |
11/07/2006 01:49:00 PM
I agree it's a bull flag breakout, but with unimpressive volume. Nice price target though of around $75ish based on the flag pole. I would probably set a more realistic target at around the March 06 peak of around $73 though. Reward/risk of at least 2:1 if you set stop at a close below $64 and possibly better if you set a tighter stop. Due to below average volume and election results coming later today, however, I'm inclined to wait until tomorrow and see if we get a bit of a post-election sell-off (recognizing that I may miss it).
Andrew
Posted by Anonymous |
11/07/2006 01:54:00 PM
I would still take the trade, but change my minimum price target to half the pole.
Posted by Amy |
11/07/2006 02:07:00 PM
I would wait for confirmation on this bullish flag. It hasn't broken out yet, so it's still on my list. Volume and breakout and I'm in. Stop would be about $66 and target would be about $75. I would look at the Dec$65.
Posted by Anonymous |
11/07/2006 03:21:00 PM
I saw this yesterday as a diagonal channel/flag heading down to support at 63.40. Yesterday, it barely broke out of my channel. I didn't get in because of low volume and it didn't close enough above the channel. Today's climb fixed that problem. Actually, a little better than I like!
Tim
Posted by Anonymous |
11/07/2006 06:37:00 PM
it is a bull flag breakout but the breakout pulled back by end of day. I was already tracking this and am waiting for a confirmed breakout above 67.4
Mahmood
Posted by mahmood |
11/08/2006 06:16:00 AM
Downgraded by BMO today :(
Posted by Anonymous |
11/08/2006 08:59:00 AM
Bull flag (horizontal flag)on a nice up trend. 11 point possible move.
I don't see this as a break out yet. I have the breakout needing to close over 67.35 the high of Oct 26 and the low end of the flag at 63.55.
Implied volatility is still bleeding off so I'm in no hury to anticipate the break.
I would most likely purchase the OTM call at $70 for January. The December strike seems a little too short in time to get the full benefit of the possible move.
MikeH
Posted by Mike |
11/08/2006 02:14:00 PM