 Post feed
Can Fibonacci Lines Offer an Advantage as a Trading Signal?
 on Fibonacci retracements to get us started. Leonardo Fibonacci was an Italian mathematician from the 12th century who discovered a series of numbers that equal the sum of the two preceding numbers. (Ex: 1, 2, 3, 5, 8, 13, 21, 34, etc) These numbers, happen to be exactly 1.618 times the preceding number. Many things have dimensional properties that revolve around the ratio of 1.618, so it seems to relate to many aspects of life. Take honeybees, for example. If you divide the female bees by the male bees in any given hive, you will get 1.618. Sunflowers, which have opposing spirals of seeds, have a 1.618 ratio between the diameters of each rotation. This same ratio can be seen in relationships between different components throughout nature.
Still don't believe it? Need something that's easily measured? Try measuring from your shoulder to your fingertips, and then divide this number by the length from your elbow to your fingertips. Or try measuring from your head to your feet, and divide that by the length from your belly button to your feet. Are the results the same? Somewhere in the area of 1.618? The golden ratio is seemingly unavoidable.
So this means there is also correlation between these numbers and the prices that a stock will retrace to during a pullback. Using the interactive chart, you can access Fibonacci Lines by right clicking on the chart and selecting "Drawing Tools." You will want to draw these lines by picking an extreme high and extreme low point on the chart and moving the tool from one extreme to the other. Once the outer lines are set, the inner lines will be automatically formatted to your graph. You can use these lines as targets of where to enter or exit a position and you will be surprised at how consistently stocks will use these lines as resting points in midst of a trend.
Look at WFMI as an example. I am using a 2 year chart in this sequence to show a decent rise and fall in it's trend.
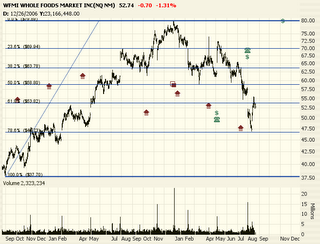 When using this tool, I will draw my lines staring from the extreme bottom (Sept of last year) and pull them up to my extreme high (Dec of last year). Your time frame can be intra day movements or longer term movements, it all depends on what your time horizon is. The application remains the same of how to draw them. The Fibonacci lines will seem to fall around congestion points for the stock price. The lines tend to catch the tops and bottoms of price movements. These are helpful especially if the stocks support or resistance areas correlate to these lines. It makes them more potent. If you look recently at the highs & lows of WFMI, the last bottom happened to reach the 78.6% line and the recent high at the good ol' 61.8% line. If the stock turns down from this line, perhaps another drop down to the 78.6% line can act as a target price? Without using Fibonacci lines, $47 was my initial target price. This indicator just enhances the likelihood of this outcome.
Want to learn more about using this technique? Tune into our Adv. Technical Analysis Trading Rooms session on support & resistance.
I am done for the day. I created a light workload for today, which means I have a tee time at  4:00 at Tri City Golf Course. Tomorrow morning will be back over to River Bend with the same Wednesday crew. I really want to start posting on the similarities between trading and golf. Through a recent chain of e-mails, I was inspired. There is a strong possibility I will post again tonight about todays market, so check back. Last night this site received the most hits in a single day that it has ever received. Thanks for doing your part!
FORE!


I absolutely adore reading your blog posts, the variety of writing is smashing.This blog as usual was educational, I have had to bookmark your site and subscribe to your feed in ifeed. Your theme looks lovely.Thanks for sharing.
regards:
Options Trading
Posted by Options Trading |
4/19/2011 12:25:00 AM
Options Trading |
4/19/2011 12:25:00 AM