8/31/2006

All That Glitters...

I wrote a search on the website with that title, and thought I should have been telekinetically combusted for being so corny. As I wandered aimlessly trying to find the next victim in my trading account I stumbled across some interesting results. Gold stocks cleaned up today. Click here to see the 1 day returns for the gold & silver mining stocks today. For a ho-hum day in the market, I was impressed to see Gold rally so well. A little good news in a group goes a long way doesn't it?

Since we discussed triangles earlier today, look at the ascending triangle on the Philly Gold & Silver Index...XAU. A move beyond $150 might constitute a breakout. I love when gold stocks rally because some traders will over do it and push these stocks beyond reasonable limits it seems. I am only speaking from experience, but anytime I trade gold in the heart of a rally, they become memorable trades. Keep Gold on your radar right now.

Tonight is my presentation on credit spreads. After the class I will post the trades we looked at.

Anyone have a funny joke to share? I'm in need of a good laugh...

Thank You

I wanted to leave a quick "Thank You" to all of you who participated in Rich's fundraiser that I mentioned on Monday. I noticed he is halfway to his goal, and I want to thank those who have made a contribution. My Family appreciates your gesture and so do all the kids and families out there hoping to find a cure. You are awesome!

Triangles

I gave a presentation in Master Talk a few weeks ago about Triangles. This will be a follow up to that presentation and hopefully answer a few lingering questions that are still out there on the topic. First off, let me define what a triangle is. A Triangle is a formation on a price chart that looks like a triangle, and triangles happen to be continuation patterns, meaning once they are confirmed, the stock should continue it's trend. Spotting a triangle means something depending on what kind of a trend you are in, and what kind of triangle you see. There are three types of triangles...

1. Ascending Triangles- This is a bullish continuation pattern. Ascending triangles should be found in uptrending stocks, which signals that once the pattern has confirmed, the bullish trend will continue.

2. Descending Triangles- This is a bearish continuation pattern. Descending triangles should be found in downtrending stocks, which signals that once the pattern has confirmed, the bearish trend will continue.

3. Symmetrical Triangles- This is a neutral continuation pattern. Symmetrical Triangles can be found in either uptrending or downtrending stocks. Once the stock has chosen a direction to break out in, the prior trend will continue.
Three more things to discuss....

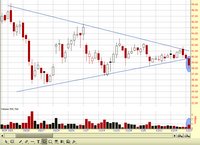
Confirmation- When I use the word confirmation, this is when the stock price CLOSES above or below a support or resistance level along with heavy volume (at least higher than average volume). Here is an example of a confirmation of a symmetrical triangle.

Re-Tests- After a breakout, it is not uncommon to see the price rally back to the area it broke out of. Here is a another picture that shows the stock above after the initial breakout, rally back up to old support and use it as new resistance. This is called a re-test. Re-tests are great entry points if you missed the breakout. Volume is not as important on the re-test as it is on the breakout. Pattern Failure- After a breakout, if the price ever traces back within the body of the pattern before reaching a target, this is considered a failed pattern. Also, if the stock breaks out in the wrong direction this is a failed pattern as well. (Ex: If I am watching an ascending triangle and the stock breaks support instead of resistance.) If either scenario happens, I take the loss and move on. Here is an example of a failed pattern.


If you are feeling lost, I won't discuss advanced topics forever. If many of these recent posts are intimidating for where you are in your education, I will try and mix it up occasionally.

8/30/2006

A Comprehensive Guide to the Black Scholes Calculator

I am getting bombarded with e-mails about options pricing this week. This is the exact reason why I got INVESTools to let me teach a course on this topic. Hundreds of you option traders out there have questions on material that you haven't covered yet. Get access to these sessions ASAP. It will give you the "Ah-Ha" moment your mind and soul have been longing for, and will create peace and tranquility in my inbox.

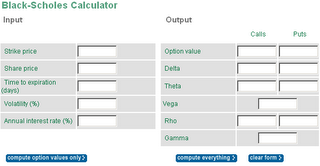
In the meantime, I will attempt to provide a "teaser" on the functionality of this tool, and a few ways it can be useful. This may generate a few questions and I will try to be as thorough as I can be. Let's start with a picture of the model. To get there click the "black scholes calculator" link located on the left hand side of your stocks Corporate Snapshot. Here is a picture of what you will be working with...


What made this model so popular was the limited number of inputs, and relatively simple math equation to produce values. I'm not touching the math tonight, just where to get the appropriate data to get started. You have five inputs you need to fill to get your price, let's discuss the details...

1. Strike Price- Any questions on where to find this? Good, let's move on.

2. Stock Price- Jeez...this is getting complicated!

3. Time Til Expiration- Slightly more challenging, I must admit. If you dare send me an e-mail asking where to find this information, I might be tempted to reply to you with a computer virus attached. JUST KIDDING. If you don't really want to count, go to the Options Greeks page and click on T-VAL next to the option in question. In the upper left hand corner you will see "days til expiration."

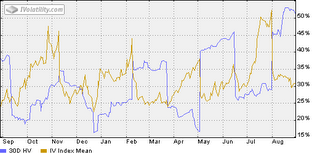
4. Volatility- Now it's getting interesting. If you don't fully understand implied volatility yet, click here. (I love to hyper-link myself!) To get volatility information, I will click on MY LINK to the CBOE on the right hand column of my blog. Let me also inform you that there are several ways to get the volatility figure for this calculation. You can also retrieve it from the greeks page, or the volatility page on the toolbox. I prefer CBOE since I can see a chart of volatility and read it's trend, which we have already discussed in the past. Anyway, when you get there type in the symbol of your stock. Once you have done that, there will be a thumbnail chart on the right hand side that says "volatility chart." When you click on it, you should see something like this...

All you will really need is the current "IV Index Mean" which is the current average implied volatility. Plug this figure into the calculator.

5. Annual Interest Rate- To get this figure, type in symbol IRX.X on the corporate snapshot, or $IRX on the Interactive Chart to get the current value. As of tonight, 4.92.

Now you should be able to click "calculate everything" and get not only the theoretical option value, but also theoretical greek values as well. "But Jeff...Why would you do this when all you have to do is look at the ask price to get the current option value lol?" Let me explain, I do not do this to get a current valuation. I prefer to use this to get an idea of what my option would be worth if the stock price moved...or if time has decayed...or if volatility has moved. Use this to create different "what if" scenarios. As I anticipate certain movements in the stock price, I will input my projected stock price...I will input the change in volatility I am expecting...and subtract how much time I expect this to take...and wahlah! I now have a theoretical value of what my option should be worth if this all goes as planned. Sweet!!!

HOMEWORK: Practice this concept. I want you to do two different calculations. One for an ITM option, and one for an OTM option. Here are you parameters.

ITM- Strike 50, Stock Price 55, Time 45, Volatility 30, IR 4.92.

OTM- Strike 60, Stock Price 55, Time 45, Volatility 30, IR 4.92.

Try these experiments. On each calculation, try to factor a $6 price move. Ex: change stock price from 55 to 61. Subtract 15 days in which it took this movement to happen. Compare the % returns for an ITM vs an OTM.

Next, go back to the original parameters, and factor a loss in price. Let's say a loss of $3 per share. Ex: change stock price of $55 to $52. Subtract 15 days in which it would have taken this to happen. Compare % losses for an ITM vs an OTM.

Finally, I want you to practice tweaking volatility a little. Do it in a realistic fashion. Try changing a volatility of 30 to 40. Run a few different scenarios until you feel more comfortable with how these different puzzle pieces and their changes affect that option price.

I know this might be challenging at first, but read this a few times and experiment a little until its becomes clear. If not, get into my trading room session where we can discuss this in explicit detail.

.

.

Now I am off to bed...I can't believe I am still awake.

Rainy Days and Wednesdays...

If you were planning on making money in the market this week, perhaps you didn't get the memo. The market is officially "uninteresting" until Tuesday, September 5th. Since the holiday weekend is coming up, there will be low volume and low levels of activity until then. This is the last chance for participants to take a summer vacation, and to spend their hard earned money before donating it back to the market. In essence, the market might as well just have closed for this week. Anyone else feel the same way?

I have lost a little "mojo" today after a horrible round of golf this morning. Wednesdays are when I work into the night, so I play golf every Wednesday morning to ease the pain. This is also the week that I have rotated out of the Master Talk shift. Not having to prepare a presentation is comforting, especially since I was already in a bad mood. However, if I were teaching Master Talk, I had an idea of what I wanted to talk about. I have wanted to discuss the differences between short term, intermediate, and longer term traders. I notice in many peoples trading rules, they mix short term approaches with long term exits, and get a lot of rules crisscrossed. This is natural of course, with many people not knowing the difference. Next Wednesday I propose we talk about this in our discussion. Either that or Advanced Shadow Gamma followed by measurements and correlations of vega on double binary options. (I can be a geek sometimes.)

I am still thinking of a topic to discuss for my evening post. I am running out of brain power relatively early this week. As always, when an idea pops in your mind, send me an e-mail on what you are interested in. I will then try and humor you with a post in response.

Be back shortly...

8/29/2006

In an earlier post today, I presented the list of Option Strategies with the highest "Mathematical Probability" of success. I hope each of you had a chance to read it. Now I want to discuss how to use Risk and Reward when determining an option play or strategy.

First let's define risk. Merriam Webster says, "the chance that an investment (as a stock or commodity) will lose value." Next, let's define reward. Merriam Webster says, "something that is given in return for good or evil done or received or that is offered or given for some service or attainment." Finally, let's define risk/reward ratio. I would go as far as saying..."A ratio used by many investors to compare the expected returns of an investment to the amount of risk undertaken to capture these returns. This ratio is calculated mathematically by dividing the amount of profit the trader expects to have made when the position is closed (i.e. the reward) by the amount he or she stands to lose if price moves in the unexpected direction (i.e. the risk).

When deciding on a strategy to use, you must consider what risks are involved, and what the potential outcome could be (reward). Some may already be familiar with the risk-reward concept, which states that the higher the risk of a particular investment, the higher the possible return.

My earlier article captures the strategies with the highest probability of success, but with a higher probability of success comes a smaller reward potential. If there were a high probability trade with huge reward potential, every trader would be taking that same trade, and no one would want to be on the other side of that deal (lower probability & lower reward).

Most of you know a little about my background. I am the Unicorn of the bunch. I don't go for the "easy wins" because I don't make a lot of money doing it. I go for the long shots. While taking these chances may not result in many wins, I have never judged a successful trader by his batting average. I judge him by the amount of money he has in the bank. With a low probability strategy, you may not be right very often, but when you are right there is a great reward behind accomplishing this feat.

All traders are not created equal! You might be comfortable trading the high probability strategy with many small rewards, or prefer the low probability system with high reward. This is for you to decide, not me. However I highly recommend whichever strategy is chosen, be in control of what is at risk, because the improbable loss could be around the corner, and that changes everything.

We have talked thus far about strategies, but how about individual trades? I want to use a couple examples to help illustrate how to apply risk/reward to each trade. Assume I have an option I want to purchase for $4. The stock is trading at $60, and I am expecting a $6 move out of the stock. Let's assume when the stock makes this move, the option will be trading for roughly $10. My reward in this trade is $6. What risk am I willing to absorb to make this $6? Let's say I use a 50% stop, meaning once the price of the option hits $2, I exit the trade getting $2 back. In this example, my risk is $2. If I do the math...my reward of 6 divided by my risk of 2 equals a reward/risk ratio of 3:1.

Remember, our reward is only as reliable as our forecast. The more factors you have pointing to this potential move increase the probability of the move. You also control risk...so if you want to tighten a stop order, do it! Just make sure it is not so tight that you lower the probability of getting the profit (stopped out). I hope this was helpful for some. If you don't walk away from this with anything, at least know that you ought to be comparing your potential profit to what you are willing to risk. Aim for the higher R/R trades...3:1...4:1...5:1...etc. "But Jeff, where do I find these trades?" (That is what you are thinking, right?) This is why I trade pattern breakouts, where stocks can have huge target prices. If I set that up with a low probability trade, with a potential for huge gains...it increases the likelihood of making more money than I lose. Which is the lesson every trader needs to learn on their own....how to make more money than you lose.

One last example...If you trade 4:1's and are only right 30% of the time... You have three wins that equal $12 (4x3=12) and losses that equal $7 (7x1=7). You'll walk away up $5 in this scenario. Anyway, run a few numbers and be cognizant of this in your trading and strategy decisions.

Yours Truly,

Price Patterns Class 8/29

Here is a quick compilation of symbols for various patterns we followed up on and introduced for this week. Keep an eye out for breakouts of each of these patterns.

FCX- Ascending Triangle. Not an ideal location being at the bottom of a pullback, but worth watching regardless.

JLG- Descending Triangle...BROKE TODAY

PTEN- Inverse Head & Shoudlers pattern, no sign of confirmation yet.

ARG- Already had confirmation, but strong re-test today!

TKR- Large Symmetrical Triangle, still waiting for confirmation.

OIS- Descending Triangle

THE- Descending Triangle

ATI- Descending Triangle

MLM- Desceding Triangle

BTU- Descending Triangle

DIS- Symmetrial Triangle

TTI- Symmetrical Triangle

CVD- Pennant formation

As with all trades we watch in this class, no trades should be taken until a confirmation is given. The general rule on confirmation is a closing price to land outside a target support or resistance line accompanied with heavy volume.

The Mathematical Probabilities of Option Trades

I take no credit in the information contained here. This just happened to be on my list of suggested topics to discuss. McMillan takes the top ten strategies that have the highest mathematical chances of success and documents them in his book titled "Options as a Strategic Investment." Keep in mind the strategies discussed here totally discount the investor out of the equation- financially and psychologically. Keeping all things equal, these are just a list of strategies that have the best chances of profit. Notice how the strategies taking in large amounts of time value are the one's located near the top of the list!

Keep in mind, some of these strategies you may not have heard of, but it will give us opportunity to talk about them in greater detail down the road. Some of the strategies involve naked options and are considered high risk.

1. Ratio Writing- An options strategy in which an investor simultaneously holds an unequal number of long and short positions. An example would be having more short positions than long positions.

2. Ratio Spreading- An options strategy in which an investor simultaneously holds an unequal number of long and short positions. An example would be having more long positions than short positions.

3. Straddle Writing- An options strategy carried out by holding a short position in both a call and a put that have the same strike price and expiration date. The maximum profit is the amount of premium collected by writing the options.

4. Naked Writing- An option position held by a writer who does not hold a long position in the stock on which the option has been written.

5. Calendar Spreads- An options or futures spread established by simultaneously entering a long and short position on the same underlying asset but with different delivery months. Sometimes referred to as an inter-delivery, time or horizontal spread.

6. Covered Calls- An options strategy whereby an investor holds a long position in an asset and writes (sells) call options on that same asset in an attempt to generate increased income from the asset. This is often employed when an investor has a short-term neutral view on the asset and for this reason hold the asset long and simultaneously have a short position via the option to generate income from the option premium.

7. Debit Spreads- Two options with different market prices that an investor trades on the same underlying security. The higher priced option is purchased and the lower premium option is sold - both at the same time. The higher the debit spread, the greater the initial cash outflow the investor will incur on the transaction.

8. Butterfly Spreads- An option strategy combining a bull and bear spread. It uses three strike prices. The lower two strike prices are used in the bull spread, and the higher strike price in the bear spread. Both puts and calls can be used.

9. Buying ITM Options- The purchase of an option contract with intrinsic value.

10. Buying OTM Options- The purchase of an option contrat with no intrinsic value.

Just an interesting piece on the probabilities of an option trade. Remember that this is only looking at the mathematical and statistical equations rather than systems or individuals. The question now becomes, do you go for the probable win...which includes a small reward...or do you go for the lower probability trade, with a huge gain potential?

Be back in a flash!

8/28/2006

This Weeks Top Ten List

Assuming we will be leaning bullish this week, I developed a list of upward biased stocks to research for trades this week. These look like they were bouncing off some level of support or reaching new highs. Since we are seeing a bit of a bounce from the market as I mentioned in an earlier post today, perhaps these stocks might provide some upside in this potential move. Remember the news coming down the pipe this week before trading anything!

1. USNA- Good company in a upcoming group. Looks like a bounce, indicators starting to confirm.

2. CERN- Strong performer recently, looks like it might be poised to head upward again.

3. BAM- Great performing stock over longer periods of time. Looks like it is ready to start making new highs.

4. CTSH- Amazing fundamentals...good news today. Ready to make new highs.

5. SEIC- Re-testing the old resistance of an ascending triangle. Good uptrend.

6. AMG- Breaking out of a bull flag pattern? Looks like a bounce either way.

7. NFG- Uptrend, good group....not very volatile. Conservative trade for the week.

8. GMR- Strong group, perhaps at support.

9. OMM- Strong group, perhaps at support.

10. OKE- Another strong group, perhaps a support bounce.

After tomorrows session on Price Patterns, I will list the patterns on our list for this week. I found a ton of triangles to watch. Plus, many of the patterns out there have not broken out yet.

One more thing. I noticed a few of you made contributions to the Autism walk. I appreciate your kindness and generosity. My son thanks you also.

Back in a few...

Making a Difference

I have to take time aside to share something that has really made an impact on me. I have been able to meet many people through this job. I love to meet new people. "You can never have too many friends," as I always say. A few months ago I met a gentleman named Rich. I believe it was through a Trading Rooms session, or perhaps Master Talk. We have similar trading styles and point of views, so we had plenty to talk about. We have kept up communication through e-mail and an occasional phone call to talk about trading and other various topics. I was always impressed by his drive and motivation to learn.

I am writing about Rich today because last week he sent an e-mail that really touched myself and my family. I want to share part of this e-mail that he sent.

"Could you please share with me your son's name? I am signing up for a walk through "Autism Speaks" to take place here in Tampa, Florida in November and will be walking in celebration of your son's name (the organization asks if we'd like to walk in honor of somebody...your family is the only one I know of first hand battling this). Your story has touched me greatly and I've been searching for a cause to commit my time and energy to. This hit me like a brick wall recently and I'm committing to do my part at making a difference. As I told you I have a 4 month old daughter and I just melt everytime I look at her. I cannot begin to imagine the passion you must have to free your son and all children from this very challenging disease.

In addition, I would love to meet your son in person before the walk. Maybe I'll fly out there for lunch or dinner with you guys before the event. I would love to put a face with a name and walk my heart out for him here in Tampa this November. Maybe I'll even get a tshirt with his picture on it just for the walk. I want him to know that there are people all the way across the country pulling for him.

I really love kids and would appreciate the opportunity to help make a difference. You mentioned your coin "Gratitude"...it's funny, I carry one in my pocket that says "Vision" and on the back it's says "vision is the art of seeing things invisible to others". There's a whole future ahead of this cause that we cannot currently see. But with a strong enough vision and enough people we can move mountains. And I want to be there for it."


As many of you know, my 3 year old son Jaxon has Autism. He is my hero. When I received this e-mail from Rich, it hit me like a ton of bricks. I try not to deviate from educational info on this site very often, but today was a must. Receiving an e-mail like this and seeing that relationships and friendships run this deep, really stirred some emotion in me. I have always loved to teach and always tried to go the extra steps to help others, never really expecting anything in return. This e-mail really made me realize how there are genuine, caring and loving people out there. This effort that Rich has decided to participate in has really made every labor I have ever given well worth it. I wanted to share this with everyone so you can see the quality of people around you. Rich has become a hero of mine and my family. I am passing along a link to support him in this endeavor that takes place in a few months. Here is a copy of another e-mail...

"Dear Friends and Family,
Autism Speaks is getting ready for its annual signature event, Walk for Autism Research. I am planning to be a part of that Walk and I am asking you to join me in raising critically-needed funds for autism research by
making a contribution in support of my Walk.
Autism is a complex brain disorder that often inhibits a person's ability to communicate, respond to surroundings, or form relationships with others. First identified more than 50 years ago, autism is typically diagnosed by the age of two or three. Autism affects people of all racial, ethnic and socioeconomic backgrounds.
Few disorders are as devastating to a child and his or her family. While some people with autism are mildly affected, most people with the condition will require lifelong supervision and care and have significant language impairments. Many children with autism will never be able to tell their parents they love them.
Currently, the causes of autism are unknown and there are no specific medical treatments or cure. Physicians have no blood test or scan that can definitively diagnose the disorder. As such, the diagnosis of autism is based solely upon observations of behavior. Despite increasing national interest and high prevalence, autism research is one of the lowest funded areas of medical research by both public and private sources.


Whatever you can give will help! I greatly appreciate your support and will keep you posted on my progress.

Sincerely,

Rich Strehl
Click here to get to my personal page and make a secure, online donation"


I am not sharing this to look for donations, although I am not discouraging it. My friends, family and I have supported this cause since day one, and will continue to do so, especially to get behind Rich and his efforts. The main reason I am sharing this is to reinforce one of life's lessons. Rich is taking a step to make a difference in the lives of others. Your lives will be positively impacted when you take time to help someone in need. I continuously mention what my intent is for this blog. I want to see a place where people can network and help each other reach common goals and aspirations. Let's keep working towards this goal. Look what positives are coming out of it! In the meantime... If you are reading this Rich, you are an amazing person. It means a lot to me that you are taking time out of your life to make a difference and to support my son. Thank you.

Next time you see Rich on a session, send him a note and tell him what an awesome guy he is.

Support Bounce?

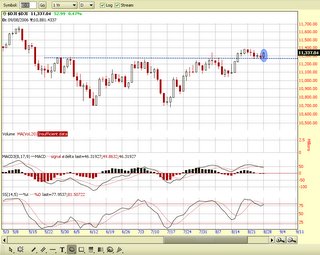
Hopefully everyone had an awesome weekend. I saw the movie "Invincible" this weekend. The one about Vince Papale. Hands down one of the best movies I have seen in awhile. I highly recommend it. I also had a decent turn out for this mornings session on option pricing (THANKS!). How about that market this morning? Are we really bullish on the market? This is what has me curious...take a look at the Dow...

I think if we can sustain this support we might make a few decent moves this week. However, you will want to watch out for the Fed minutes tomorrow and unemployment data on Friday. If we see some more positives on inflation, we might start trending again.

I will provide a watch list later today for stock to keep an eye on. I also received a suggestion to do a top ten list relative to our discussion on options. Sounds fun, but still trying to piece together what it would entail. Regardless I have 3 or 4 posts ready for today. I'll be all over the map today...

8/25/2006

Implied Volatility Part II, Applying Vega.

Not too much longer before we can kiss the "dog days of summer" goodbye, and start getting into the year end rally. Keep patient, a good atmosphere is right around the corner. For now I want to leave you with a little educational "nugget" before we close out a relatively good week.

Back to the topic we discussed yesterday about implied volatility...I talk a lot about my preference to trade OTM options over ITM options because OTM's are more sensitive to changes in implied volatility. This is where vega comes into play. Let me define it and how to apply it.

Vega measures the sensitivity of the price of an option to changes in volatility. A change in volatility will affect both calls and puts the same way. An increase in volatility will increase the prices of all the options on an asset, and a decrease in volatility causes all the options to decrease in value. However, each individual option has its own Vega and will react to volatility changes a bit differently. The impact of volatility changes is greater for out-the-money options than it is for in-the-money options. While Vega affects calls and puts similarly, it does seem to affect calls more than puts. Perhaps because of the anticipation of market growth over time.

I trade OTM options because if I am able to take this option and watch it become at-money(or ITM), then I see a big change in time value, which is represented by vega. Many of my trades are based on profiting on price movement AND a volatility movement. If you are expecting a big upswing in volatility, trade an option with a more sensitive vega and you will be smiling all the way to the bank. If you want an option that is dull to the effects of volatility, trade ITM. Simple as that!

Next week I will show you a more constructive approach to this. I want to introduce the volatility skew to you. It will be helpful to see this and how time decay can actually be reversed...meaning you can actually make your time value grow!

I want to keep expanding on this topic. This post here was somewhat generic. We will continue to chip away at this until we all feel more in control of how to select the proper option for our analysis. When you know all the"in's and out's" it will be so much easier to select the right vehicle. More profitable too!

Thanks for all your efforts this week. The activity is increasing, and keep continuing to do your part. I also want to credit one of our members for this awesome photo he created of me. (This was based on a comment that was left about who I supposedly look like.) Striking resemblance!!! Keith, if things don't work out in trading, I will hire you as a graphic designer for this blog! You have a gift, thanks for sharing!

As always, get out there and have a relaxing weekend. Leave the emotion and the stress behind, and do something you enjoy. I will likely play a little golf tomorrow, and take my kids up the canyon to the Provo river on Sunday. My boy loves to "throw rocks in river!" If you can... attend my session Monday morning and ask lots of questions. There are a lot of details to uncover on option pricing. Thanks for staying in touch, have a great weekend.

Jeff

Did you miss me?

I was asked today to write and read a script that will be used as our "Hold Message" next week when you call the 800 number. This is what has kept me from my posting today. If you would prefer not to listen to the message, I copied the text of what I wrote. It is a snapshot of this weeks market activity, followed by a generic forecast. It goes a little something like this...

"Hello...this is Jeff Kohler. Some of you may recognize my voice from the INVESTools Trading Rooms sessions. I teach courses on Price Patterns, Credit Spreads, and a new session on Options Pricing & Volatility. You may also recognize me from Master Talk on Wednesday nights where we discuss market conditions, potential trades, and various strategies that are cohesive with the current market environment.

I have been given the opportunity to present to you, a market overview if you will. Let's start by recapping what we saw out of the market last week.

Traders remained somewhat quiet throughout the last few days. This is typical to see low volume in the summer months, especially August. However, the lack of convincing inflation data has caused the market to stall. The biggest news from last week was the continued disappointment out of the Homebuilders group. New home sales dropped 4.3%, which is the biggest drop seen since February, while inventory of unsold homes hit a record high. Take that news combined with rising energy costs, and this really puts pressure on the average consumer’s wallet... Which happens to be the main driver of our economy.

The major averages finished the week on a down note. The Dow Jones Industrial Average was down .86% for last week, the S&P 500 down .55%, and the Nasdaq finishing with the biggest loss of a 1.09% drop in last weeks activity.

The price of oil has been busy as of recently. There has been a steady rise in the price of light sweet crude as we approached week end. With uncertainty in the Middle East concerning a possible blocking of oil exports, combined with early concerns of what could be "Tropical Storm Ernesto," light sweet crude for October delivery closed at $72.51 a barrel. While the storm is still in its developmental stages, forecasters claim it is still too early to tell its significance or the potential impact it could have if it reaches the Gulf of Mexico. As you know, most offshore oil and natural gas facilities are located in the gulf. No matter the severity of the threat, energy companies are preparing for hurricane season regardless, and taking the all the necessary precautions due to the disasters last years storms left behind.

Now that we have recapped last week's activity, let's discuss what to expect in this upcoming week. Major earnings announcements have started to trail off now that we are nearing the end of the third quarter. The big economic announcements taking place next week will be the release of the FOMC minutes on Tuesday, and unemployment data on Friday. While most of the reaction has come and gone from the results of the FOMC meeting, the minutes will give traders a more in depth look at what was actually discussed. Most traders are hoping to gather any kind of insight on the possibility of future rate hikes.

As you maneuver through the market next week, here are a few interesting points to consider.


As you conduct a technical analysis of the major market averages, keep a close eye on old resistance levels. The prior high points from June and July may act as a level of support for this recent retracement. If the market turns higher here and continues its uptrend, this should install more bullish conviction and offer good upside opportunity in the short term.

I also recommend taking a quick look at the volatility index. To do this, go to the corporate snapshot and type in the symbol VIX.X. The VIX is now trading in its lower range. As of Fridays close it was trading at 12.31. This is significant for option traders since it means the market has reached a level of complacency. As a contrarian indicator, if the VIX starts to rise into next week, this will confirm a bearish stance on the market and you are likely to see prices continue to drop.

If you are in the market for strong stocks that are heating up in strong industry groups, I have compiled a list to share. First I recommend taking a look at the Transportation/Water Transportation group. You can access this group be entering the symbol .TWT into the corporate snapshot. I mentioned this group in a MasterTalk session last month, and they are still continuing to trend strong. Within this group you will want to add these following stocks to your watchlist for further investigation.

General Maritime Corporation- symbol GMR. This is a great fundamental company, and a leader in their group. The look as if they might be finding support and ready to make their next advance in their current uptrend.
OMI Corporation- symbol OMM. They are another great leader in this strong industry group displaying the same technical strength as GMR.
One last company in that list, which happens to be a lower priced growth opportunity, would be Diana shipping. The symbol is DSX. They are a young but strong company in this group that has a legitimate shot at competing with its peers.

Finally, I want you to keep an eye on the Natural Gas/Utilities group, which is symbol .UNG. If interest rates remain steady, these stocks have a good shot at appreciating in value. Many of the issues in this group are in existing uptrends and look as if they may have found support. Within this group, keep an eye on NATIONAL FUEL & GAS COMPANY, which is symbol NFG. It has been a steady mover and great performer over the majority of the year. A competitor to also be mindful of is symbol OKE. Having the same trend and technical strength as NFG, OKE brings slightly better fundamentals to the table yet similar technical strengths.

We have discussed a list of things to keep in mind as the week progresses. Continue to stay positive and focused on task at hand. Be diligent and thorough in your analysis, and most importantly, stay disciplined to your rules! I wish you the best of luck this week. Happy Trading."


I am going to go record it right now. I will work in another post this evening to feast on before the weekend. Thanks for your continued comments that are appearing in the blog. I love to hear what's on your mind.

PS- If you happen to see unanswered questions in the blog that you have an answer to...feel free to help others by leaving a post sharing information you may know. As you are well aware, I maintain this blog not for personal gain. I do it to help all of you. So turn around and help each other when the opportunity presents itself. It is a great feeling to be in the position to help others.

Be back soon!

Friday's put me in great moods...

I have a pretty decent workload planned for today. I wanted to get a post in before I had to really start working. I have a few topics I will discuss later in the day so check back and see what the new gossip is.

A few things I wanted to say. First, I think we took a small step in an exciting direction. In response to a list of "rules"from a post yesterday, many of you left comments to various topics last night. THANK YOU!!! It was exciting to see the comments that were left (except for the comment insulting my appearance). In fact, I want this to get to a point where I am excited to check the blog to see what each of you have posted. It's a big part of the fun!

I will be back and forth today, but will hopefully get two more posts done before the days end.

8/24/2006

How To Render Implied Volatility Obsolete...

(This is in response to my last post a few minutes ago...read that one before you read this!)

How to render Implied Volatility Obsolete.....

Buy deep in-the-money options.....if you dare!

Remember, Implied Volatility can only affect the time value of your option causing it to get bigger or smaller. If you buy deeper ITM options, you are buying less time value, which in turn will have little to no effect on your option price. I know many traders who want to skip over volatility by doing this, which is fine. I will discuss the issues I have with deep ITM options some other time. As you can see by my picture, I don't think too highly of them.

Goodnight!

Implied Volatility in Four Easy Steps

I'm taking time to write this post and hopefully enlighten your understanding of this wonderful concept. Before I get started let's define the subject for a more objective analysis.

Implied Volatility: In financial mathematics, the implied volatility of a financial instrument is the volatility implied by the market price of a derivative based on a theoretical pricing model. Or in easy terms, the expected volatility.

If I imply that the market will rise tomorrow, doesn't this mean I am expecting the market to rise? If a stock has high implied volatility, is the market expecting the stock to become increasingly volatile? The answer is yes. In the pricing of an option, volatility has a HUGE impact on how your option is priced. If volatility is high, the premium on the option will be relatively high, and vice versa.

Before we continue we need to discuss the correlation between historical and implied volatility. I shriek when someone tells me how the over/under evaluation suggests an option is over or under valued. Interestingly, the implied volatility of options rarely corresponds to the historical volatility (i.e. the volatility of a historical time series). This is because implied volatility includes future expectations of price movement, which are not reflected in historical volatility.
Implied volatility also is inaccurate due to the fact that in the US and Europe, many listed options have a market place where there is a 2-sided market with a bid (where you can sell and a marketmaker can buy) and an offer or ask (where you can buy and a marketmaker can sell). Therefore if someone buys an option on the offer the implied vol is higher for the same option than if it trades as if sold on the bid.

So thus far, we know that rising implied volatility causes options (calls and puts) to increase in value. We also know that falling implied volatility causes options (calls and puts) to decrease in value. Have you ever noticed the link on the right hand side of my blog that says "CBOE." It is there to get you implied volatility data. Click on that link, and enter your stock symbol on the left hand side. (BTW- The new toolbox will have this function on the upcoming release of the new toolbox.) When you enter your symbol, over on the right column, click on the thumbnail that says "Volatility Chart." You should see something like this...

This chart graphs two things. Implied and historical volatility. Like I mentioned earlier, there is no intelligent reason to compare the two. The future will normally always be priced higher than the past, so bet on it. What you can do here with my example on WFMI is watch that orange colored line rise and fall. This leads to the four steps I mentioned.

#1. What is the relative high that volatility reaches?

Just like finding resistance on a stock, how high does implied volatility on WFMI get? About 45-50%? This is relatively high for this stock. When I see volatility is relatively high, it means the options are relatively expensive.

#2. What is the relative low that volatility reaches?

Just like finding support on a stock, how low does implied volatility on WFMI get? About 25%? This is relatively low for this stock. When I see volatility is relatively low, it means the options are relatively cheap.

#3. Is volatility rising?

As volatility increases, for instance before an earnings announcement...the price of options gradually increase. Why? Because you are expecting the stock to move more once earnings are released. Do you think that the chart above is magical the way it peaks about every three months???

#4. Is volatility falling?

As volatility decreases the price of the options will lose their value. Of course, not intrinsic value...their time value will get smaller. IMPORTANT: Volatility only impacts the time value of your option. If you trade ATM or OTM options, these will be heavily influenced by volatility.

In closing, I hope your understanding is that ideally you want to buy options when volatility is low and starting to rise. Or if volatility is high and starting to fall, you want to sell. Also remember that when volatility is high, you might want to see why expectations are high. Perhaps earnings, judgments, FDA approvals, etc. Listen to my class on Monday mornings to go over various examples, or run over to the black scholes calculator and start inputting parameters. Change volatility numbers based on relative highs and lows.

Last comment and I am going home. How many times did I use the word "relative?" Every stocks volatility is different. For example, WFMI was as high as 50%...that might be another stocks low. Every issue is different. Remember it's not the value, but where the value has been, and where it is going.

I kick major ass for writing this tonight(patting myself on the back). See you tomorrow.


"Blogging" Rules

When I started this site I had a few ideas about how useful it could be, and the networking possibility that could be accomplished with the size of group we are working with. Since we have a decent sized group out there, I need to create a few rules to follow about blogging etiquette.

1. LEAVE COMMENTS!!!
If you don't know how to do this, let me explain. Below each post I make you will see this...

Click on the icon that says "comments." At the bottom of that page click on "POST A COMMENT." Let ME, and the world know whatever is on your mind. I want to have a big "comments" section. I think a big part of the fun is the conversations and banter that takes place there.

2. Don't just read what I write about, READ THE COMMENTS!!!

The more you read the comments, the more likely you will be to post something. A different perspective, an example, an educational piece, a joke...whatever!

3. Respect others.

It is obvious I am fishing for participation here. When you are leaving comments, just be mindful and helpful in your replies. You may be on a different level than the next person, but take your expertise and share it with us. We want to know!

4. Network

I wish I were in your shoes when I started trading. If I had a big group to work with when I started, I would be hosting parties, group vacations, etc. Whatever it takes to surround myself with others that are striving for the same goals I have, I want to be around those people. Not only for support and encouragement, but also for motivation.

Hopefully this will spark some motivation to take all of this to the next level. I want to get to the point where I am excited to log in and see what all of you have posted!!!

Those are the rules we are going to live by. I'll be back in a few.

Last Night's Set-Up's

I received a lot of e-mails this morning. Most were very complimentary about the choice of topic for last night. Even though we discussed a few general ideas, anytime we can start with a few ideas of how to create a positive attitude and discuss trading psychology, not only will it impact your trading approach, but will also help you in other areas. Professional, personal, etc. When I talked for a few moments on quantum-physics and the water molecules experiment I should have expressed more clearly that I am no chemist or biologist. It was an interesting story I heard while dining with a good friend of mine. For those that were offended, no ill-intentions were meant.

We followed up on last weeks trades...PXK, ATI, OIS, and BUCY. BUCY was the only trade that generated a signal. BTW- I met someone in our three day class today, and no sooner than I shook his hand, he pointed out I was wrong about this one. I appreciated that, since it helps me to check my emotions and take opinions with a grain of salt. In the past when I felt accused or blamed, I would become defensive and instinctively throw people through walls. (My psychologist has done wonders for me!) Just remember not every trade will make money, right? Just make sure when you take a trade from another persons research, and it fails, try and feel equally responsible for overlooking it's weaknesses before jumping in. Each time one of my guys here gives me a reco and it results in a loss, I blame myself for not seeing the weakness before jumping in. I stopped blaming others for my misfortunes long ago, and worried about what I could be doing differently, and my perspectives in life have taken a 180.

Anyway, Here is the short list of set-up's we looked at. All bearish babies...


These were all short term, going with October options, one strike in or one strike out depending on how aggressive or conservative you are. What is funny is that I believe they all went up today. Such is life. That's ok. I DARE YOU TO SEND ME AN E- MAIL BLAMING ME!!! I might need to give a certain "button" on my keyboard a rigorous workout!

Just kidding!!! You all know I read each and every e-mail, and care about everything that is on your mind. Since I discussed where to place blame, I thought it was funny. I promise I won't delete any e-mails.

I will get a decent post going after I finish my deadline for today.

8/23/2006

Countdown to Master Talk

Break out the coffee and diet pills East Coast dwellers...Master Talk starts in less than an hour. I wanted to post this weeks trading quote given by Randy McKay, who is another Market Wizard before we start. He says:

“When the trade is easy, I want to be in, and when it isn't I want to be out. In fact that is part of my general philosophy on trading: I want to catch the easy part. I never try to buy a bottom or sell a top. Even if you manage to pick the bottom, the market can end up sitting there for years and tying up your capital. You don't want to have a position before a move has started. Too many traders try and put their own opinion of what will happen before the market action. When I get hurt in the market, I get the hell out. It doesn't matter at all where the market is trading. I just get out, because I believe that once you're hurt in the market, your decisions are going to be far less objective than they are when you're doing well. If you stick around when the market is severely against you, sooner or later they are going to carry you out. I'll keep reducing my trading size as long as I'm losing... My money management techniques are extremely conservative. I never risk anything approaching the total amount of money in my account, let alone my total funds. You have to be more concerned about the moves you're in than the moves you're not in. You must get out of your losses immediately. It's not merely a matter of how much you can afford to risk on a given trade, but you also have to consider how many potential future winners you might miss because of the effect of the larger loss on your mental attitude and trading size. Nowadays, the breakouts that work look similar to the breakouts that are sucker plays. In fact, the false breakouts probably outnumber the valid signals. Every trader is going to have tons of winners and losers. You need to determine why the winners are winners and the losers are losers. The most important advice I have for traders is to never let a loser get out of hand.”

Tonight's topic will be on Money Management and Trading Activity. Trading Activity is a pretty vauge description. The details focus on controlling fear, greed & stress... how to cope with past, present & future... engaging in positive habits...and incorporating a end of day review.

See you tonight!

Exercise Your Right to Love Me

Maybe that statement is a little overboard? Perhaps. But if you take my bearish list from Monday 8/21, you can clearly see that so far we are 7 for 7. I wrote this while thinking happy thoughts since being superstitious is a big part of trading. It is bad to talk about trades "mid-swing" or start bragging about profits before you take them. You never know when you will "jinx" what you have accomplished.

Speaking of "jinx," this might be a good moment to discuss my losing streak during June/July. I had a couple things pegged that I thought were the reasons behind it, but it wasn't until Erin (My trading therapist) told me that my normal selections and my state of mind were skewed pretty bad. Since I was sharing my watchlist and trades while still in them, this was altering my focus and my selection criteria. There is a serious level of accountability that comes into play when you are in a position like mine. However, I used to love being in that position. It's one thing to be a successful trader, but it's another to take what you know and watch someone else turn successful right along with you. When you are in a zone, it feels like you are able to see the future. At those times I tend to lose focus on the money being made, and saturate myself in the process. When it becomes mechanical, and you get in that zone, the mechanics that take place amaze me. Watching the precision of the entries and exits, and seeing the set-ups unfold before they even signal. It is a beautiful thing when you are "on."

In the past I have been able to separate what I do in my account vs. what I share in a presentation. In the early stages of my losing streak the lines started to cross. When you can sense emotion starting to creep into the equation...WALK AWAY. Some of the worst decisions take place when you let fear and greed into your head. Instead of following my rules, or taking trades I normally would, my mentality shifted from the weight of what is going on in my account, to the weight of what is going on in everyone else's accounts. This causes you to make different decisions.

Just to clarify, this losing streak wasn't that bad...but earlier this year I was right about 60% of the time on 3:1 or better trades, with a focus of taking small losses. I was on pace to slaughter the returns I made last year. Then into July, I was right about 20% of the time. I gambled with losses a little, my R/R was 3:1 or less it seemed. I took a few losses that were too large, but still managed to keep them small...and here I am coming right out of this slump, with a strong head on my shoulders, and a learning experience I wouldn't trade anything for.

In closing don't look at losses as a bad thing...unless you don't position size properly. A significant losing streak is always out there. Just know when to hold em' and know when to fold em'.

Master Talk is starting in a few hours, gotta run. I need a curriculum. Any ideas?

8/22/2006

Market Recap

We could prossibly remove todays market action entirely off record and nobody would notice it's disappearance. The Dow ended down 5 while the Nasdaq finished up 2. WOW! The breadth of this movement support the upside, since advances nudged declines by a slim margin.

The big concern is the warning the Fed keeps issuing about inflation and rate hikes. What about TOL today? They lost money last quarter, but since they lost less than expected, this is good? The stock finished up today, with only a minor range of trading. Normally on an earnings announcement you will see at least a volatile day, but nothing of the sorts here. Think homebuilders have seen a bottom? I don't know if I am convinced, but anticipating trading ranges for a couple months unitl business picks back up.

I must admit I am still leaning bearish on the market. With such a mixed arena of emotion, I probably doesn't matter what side of the fence you are on. There is opportunity everywhere.

Keep an eye on Existing Home Sales, Durable Orders, and New Home Sales for additonal confirmation of inflation. These reports will give us a more detailed perspective. In the meantime, I am gearing up for another bear open tomorrow. However, if the reports start piling positive data, I can flip my switch and go bullish pretty easy.

Have a good night!

Stroke of Genius?

Perhaps...but I think the term genius was used a little too loosely. I am referring to the reality television show called "Treasure Hunters."If you have wathced this show, you will understand my confusion. If you have not seen this show, close this window and go about your business. Nothing interesting here!

Early in the series, I found it rather amusing that the “Geniuses” (a team in the race for the hidden treasure) along with their matched team the “Young Professionals” were the only group who went to Mt. Theodore Roosevelt instead of Mt. Rushmore. Even I had guessed Mt. Rushmore as the clues unfolded — the names of all four presidents made it obvious. Perhaps I am a genius myself?

I watch my fair share of reality TV, and this Amazing Race/DiVinci Code product was not as exciting as it was advertised to be. The most memorable moment was seeing Pat Hanlon, who was a member of the "Wild Hanlon's" sporting his retro hairstyle. Loved it. Not many men embrace this dew in all it's glory the way he did. I Also loved the creativity of this team to uncover clues. (If you watched this show, you know what horrible detectives these guys were.)

If you happened to follow this show, I hope the outcome was motivating for anyone thinking that making money is impossible, or reserved for especially talented or brilliant people. Clearly this isn't the case. $3 million dollars were distributed to the winners "The Geniuses." So I figured if these three kids could score $1 million a piece, than no financial goal is unreachable. If my article about trading small accounts earlier today brought your spirits down at all, DONT LET IT! Nothing is impossible, it just means you are going to have to work that much harder to be one of the few that generated these returns. Come On! If the Geniuses won $3 million, anything is possible!

Perhaps this post gets off track a little, but a friend of mine and I engaged in a conversation about this and I realized I wasn't the only one who felt this way. If you didn't get anything out of this, I will shoot for the fences next time. If you read this, post your favorite reality show so I can get an idea of other forms of evening entertainment.

Can Fibonacci Lines Offer an Advantage as a Trading Signal?

Plain and simple, the answer is yes. Let me provide a little background on Fibonacci retracements to get us started. Leonardo Fibonacci was an Italian mathematician from the 12th century who discovered a series of numbers that equal the sum of the two preceding numbers. (Ex: 1, 2, 3, 5, 8, 13, 21, 34, etc) These numbers, happen to be exactly 1.618 times the preceding number. Many things have dimensional properties that revolve around the ratio of 1.618, so it seems to relate to many aspects of life. Take honeybees, for example. If you divide the female bees by the male bees in any given hive, you will get 1.618. Sunflowers, which have opposing spirals of seeds, have a 1.618 ratio between the diameters of each rotation. This same ratio can be seen in relationships between different components throughout nature.

Still don't believe it? Need something that's easily measured? Try measuring from your shoulder to your fingertips, and then divide this number by the length from your elbow to your fingertips. Or try measuring from your head to your feet, and divide that by the length from your belly button to your feet. Are the results the same? Somewhere in the area of 1.618? The golden ratio is seemingly unavoidable.

So this means there is also correlation between these numbers and the prices that a stock will retrace to during a pullback. Using the interactive chart, you can access Fibonacci Lines by right clicking on the chart and selecting "Drawing Tools." You will want to draw these lines by picking an extreme high and extreme low point on the chart and moving the tool from one extreme to the other. Once the outer lines are set, the inner lines will be automatically formatted to your graph. You can use these lines as targets of where to enter or exit a position and you will be surprised at how consistently stocks will use these lines as resting points in midst of a trend.

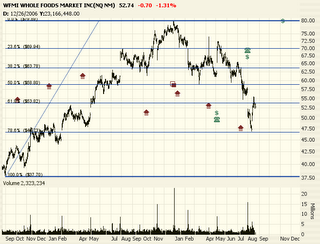
Look at WFMI as an example. I am using a 2 year chart in this sequence to show a decent rise and fall in it's trend.

When using this tool, I will draw my lines staring from the extreme bottom (Sept of last year) and pull them up to my extreme high (Dec of last year). Your time frame can be intra day movements or longer term movements, it all depends on what your time horizon is. The application remains the same of how to draw them. The Fibonacci lines will seem to fall around congestion points for the stock price. The lines tend to catch the tops and bottoms of price movements. These are helpful especially if the stocks support or resistance areas correlate to these lines. It makes them more potent. If you look recently at the highs & lows of WFMI, the last bottom happened to reach the 78.6% line and the recent high at the good ol' 61.8% line. If the stock turns down from this line, perhaps another drop down to the 78.6% line can act as a target price? Without using Fibonacci lines, $47 was my initial target price. This indicator just enhances the likelihood of this outcome.

Want to learn more about using this technique? Tune into our Adv. Technical Analysis Trading Rooms session on support & resistance.

I am done for the day. I created a light workload for today, which means I have a tee time at 4:00 at Tri City Golf Course. Tomorrow morning will be back over to River Bend with the same Wednesday crew. I really want to start posting on the similarities between trading and golf. Through a recent chain of e-mails, I was inspired. There is a strong possibility I will post again tonight about todays market, so check back. Last night this site received the most hits in a single day that it has ever received. Thanks for doing your part!

FORE!

How Do I Trade a Small Account?

This question was at the top of the list when I asked for subjects to present about. This is very important question. Before we discuss the vehicles to use, why are we poised with this question? Hopefully the majority of you have money saved. Whether it be in 401k's, IRA's, Savings, etc. You need to have money saved. If you start now by maxing out 401k's (especially if the employer will match!!! FREE MONEY!!!), put 10% of monthly income into a savings account or Individual Retirement Account, then you will be way out in front of the herd.

Let's talk about identifying your objectives. If you have the picture in your mind that taking an account size of next to nothing and turning it into a business is a nearly impossible task. I am not here to tell you what you are and are not capable of...but it will be tougher than it looks. With a small account it is hard to allocate, position size, and follow risk management guidelines. Speaking of risk, how much are you willing to risk? Is this money you can afford to lose?

I am reluctant to tell you to trade options in a small account, since this will double the odds of blowing up the account. Nor will I cop out like others and tell you that ETF's are up your alley. ETF's are the worst place you can trade a small account. I would have blown up an account in weeks trading ETF's in this market. Who can weather that volatility???

Depending on how small the account is, I would consider trading covered calls on growth stocks. If you have decent growing companies, they ought to provide strong returns on a stock position while selling calls will help the bottom line by producing income. Keep in mind that this strategy would be for the risk-intolerant.

If you don't mind aiming for the stars and are more aggressive and willing to accept the risk of loss, than trade options. You need to focus on a strong R/R and high probability trades. You also need to stay away from markets you don't feel are easy to read. I started with a relatively small account trading options aggressively and was able to blossom nicely trading options on trending stocks and stocks breaking into new highs. My more aggressive approach formed as my capital backed my confidence to take more risks. I didn't start trading as aggressively as I do now, I just molded into this form.

Another avenue is to try trading funds until you can build up enough to be dangerous. Such as bond funds, or capital preservation funds during weak economic periods like we see now. Find a fundamentally weighted index to trade. Those are the ones that typically outperform the market anyhow. For very small investments, I ran into a question the other day about CD's. My neighbor "The Banker" tells me you'll only get about $50 on your $1000. BUT if you can get that in 6 months, in 12 months thats 10% per year. NO RISK. From 8/20/04 to 3/31/06 the return from the S&P is +14.8% - looking at it that way, 10% over 1 year is OK. You can NOT base information like this in dollars - just percentages. Its easy to loose sight of things with the mind set - "its only $50".Go around to the full service banks in your area and ask for the sheet that gives thier CD rates and compare them to each other. I think the national average is only around 4% right now, but sometimes they have specials. This'll allow your money to be 'close' to you in the event there is an emergency.

There are a few ideas. There is not a general response to this question since "small account" is defined differently by different folks. Everyone also has a different tolerance for risk. Take a good look at your financial goals and risk profile before you start trading aggressive options. It might not be the answer for you!

Price Patterns Class

This morning in the Price Patterns Trading Room I threw a few patterns up for discussion and display. Included were the following stocks...

MTSC- Descending Triangle
JLG- Descending Triangle
BHI- Descending Triangle
PTEN- Inverse Head & Shoulders
ESV- Inverse Head & Shoulders
TDW- Confirmed Double Bottom
BEAV- Rising Wedge
ARG- Symmetrical Triangle
TKR- Symmetrical Triangle
FCX- Ascending Triangle

From prior classes, we are still awaiting signals from the newt list of stocks...

OIS- Descending Triangle
ANDE- Descending Triangle
ATI- Descending Triangle
MLM- Descending Triangle
THE- Descending Triangle
TTI- Ascending Triangle

There is the official list from the last two weeks of pattern surfing. I will continue to post each weeks results after the session is complete.

Thanks!

8/21/2006

Grinding

The market is telling me it is reluctant to advance this week. When I tried to ask questions, it just ignored me. Since the market is not returning my calls I am leaning a little bearish this week. Here are a few starters for this weeks lineup...(BTW- I used "Anticipating the Bounce II, Downtrending Stocks With a High MACD, and Screening for Potential Put Plays" as means to find bearish stocks. If you didn't know already, these are the only means I use to find bearish stocks...besides "DeltaTraders" Bullish Watchlist)

1. ASTE- Downtrend, rolling down from MA, good R/R*.
2. STN- Downtrend, rolling over from MA, filled last months gap, good R/R*. WEAK stock
3. RATE- Hitting resistance in a downward channel. Rolling down nicely today.
4. PNRA- Looks like it might be turning down from last months gap. Good R/R*
5. USPI- Watching this one closely. It is turning down from a $28 resistance, but mid-gap! Good R/R*
6. WFMI- Filled gap beautifully, rolling over, good downtrend, good R/R*

*(R/R= risk/reward)

I had a huge response to my casual mentioning of vega vs. delta. I also just realized a vast majority of our blog public might not have heard about this subject. I am trying to dig up an old article I wrote about this over a year ago to post on the blog. I think it might provide insight to traders about alternate factors of an option premium. I made a few calls, and hopefully I will have it available by the end of the day.

PS- FOR THOSE WHO HAVE ACCESS TO ADV. OPTIONS TRADING ROOMS, I LOADED A RECORDING OF THE PRICING & VOLATILITY SESSION. FEEDBACK IS NEEDED!!! GO CHECK IT OUT!!!

Monday

I must take a moment and thank each of you for sending an e-mail over the weekend in response to the homework assignment. For those who didn't...why not? Since I received a ton of e-mails, and yes I have READ EACH ONE, I received so many that I will not have an opportunity to respond to each of them. I did jot down your recommendation and have a list of topics to discuss. Thanks for participating!

Now on to business. I can't remember the last time I have been this pissed off. Let me give you an idea...I have been prepping for a new session on Options Pricing for over a week. I was somewhat excited...I took a few books off the shelf to study and freshen up on the topic. These books included...
Option Volatility & Pricing- Sheldon Nattenburg
I created some awesome slides and had a decent presentation prepared. I didn't count the hours it took to prepare, but if I were a consultant...my bill would be enough to send me home for the rest of the month. Anyway... I wake up nice and early, and get into work at about 6:00 am. I get logged in and ready to start the meeting when I discover that there is no meeting to start.
My session didn't get off the ground like I thought it would today. But it has taught me a few things in the process. Such as...if you want something done right...do it yourself.
I'll post again after I get things figured out.

8/18/2006

HOMEWORK ASSIGNMENT!!!

I have finished most of my slides today for Monday's class. Creating diagrams in powerpoint is a pain in the neck. I think I have just about everything covered, so I am going home for the weekend. It was a great week in the market, and it's nice to be back on my feet collecting good gains. I hope that all of you have been profitable in your trading this week also.

Next week I will be readily available to contribute more to the blog. The last two weeks between the Autism conference and this week with the enormous workload has created fewer postings. Next week I will hit it hard and have much more to offer.

Now, on to the homework assignment for the weekend. I would like EACH OF YOU that access this blog to send me an e-mail and give me a topic that I ought to address to the masses as a post. It does not need to be very detailed, but I am wildly curious about what YOU would like to read about.

In the meantime do something this weekend that will motivate you and energize you for an awesome week in the market next week. There will be money growing on trees next week, you just need to find those trees!

Take it easy....see you next week!

8/17/2006

Vega Vs. Delta

I came across a interesting article a while ago I thought I would share with you. This is an extremely important topic to an option buyer, and this will be some of the content that will be discussed in my new Monday class going forward. Take a look...

http://biz.yahoo.com/opt/060717/9755a0caaaafd655661d7d81dc2928d5.html

Have you ever bought an option, had the price move favorably, but still managed to lose money? If you have then you need to learn more about how options are priced, and the different factors that go into the pricing of an option. I think most people are so concerned with Delta to measure how much their option can make, they forget to realize how much that option can lose if the price of the stock goes down. Most people know I trade a very low delta in my option selection, but also trade a high vega. Normally this is achieved with an out-the-money option. This is an aggressive selection based on probabilities. The further out-the-money you get, the lower the probability is of a profitable outcome.

Let's digress to define the two greeks. An option Delta represents the rate of change in the option premium based on the change of price in the underlying asset. Option Vega represents the sensitivity of the option price to a change in option volatility. Once you get a better understanding of option vega you can actually profit on an option without having a price move in your favor.

I like to use the example of GOOG. Back at the mid/end of June I picked up some Sept 450 calls for $8.20. The reason for this trade was not exactly the triangle formation. I knew there was about 3 weeks until Google announced earnings. Volatility will typically rise up until an earnings announcement. As volatility rose, I watched the price of the option more than double...however I didn't anticipate the price of Google dropping a whole lot, and it did drop about $15 overall before the announcement. Try to picture an out-the-money option and what will happen to it's value with a price drop like that. Don't forget my option lost about three weeks value while I held onto it. My $450 calls that lost 3 weeks of time, and about $15 dollars from the stock price actually made me money! Not a lot...but I sold before earnings for $8.60. This might not seem like a huge profit, but without a solid vega and rising volatility, my option would not have sustained those set-backs. I was anticipating a much larger rise in volatility, but even a minor rise still created a profitable trade.

Fascinating isn't it?

Credit Spreads Trading Room Review

I just wrapped up the trading room session tonight on Credit Spreads. We discussed two potential trades one might consider trading spreads on. Here are the two we discussed in case you were not in attendance...

Symbol: IVGN
Trend: Bear Flag, Downtrend
Target: To Stay below resistance at $60 or bust!
Trade: Sept Bear Call...Buy 65 sell 60...$1.25 credit
Why?: Decent resistance, for those becoming increasingly bearish on the market this looks like a decent trade.

Symbol: COG
Trend: Intermediate uptrend, watch for a bounce & break of resistance.
Target: When it bounces around $50, target is to remain above this level
Trade: Sept Bull Put...Sell 50's Buy 45's...credit TBD.
Why?: Strong stock in a strong group. If the market continues upward, COG might travel along with it.

Case of the "Thursdays"

For some reason I am starting to hate Thursdays. I was able to trade from home early this morning (which is nice), and came into work a little later than usual. I had a deadline on Monday that I just fulfilled today. I feel so much better that it is finished though. It was a weekly article I write that goes to management. Just a little market commentary. I also have been working on developing a new trading room for all the advanced options students out there. It will be on Option Pricing and Volatility. This will be a great way to learn more about greeks, and alternate ways to profit from options other than from price movement. Very intense content. It starts Monday mornings at 9:30 a.m Eastern. Yes, this Monday morning. To get there, go to the Trading Rooms schedule and click on Session 3 on Debit Spreads. At the bottom you will see my session and it will go live on Monday morning. Hopefully I will have my slides ready by then.

So enough about me...what's going on with YOU? I notice that we have had several posts to different articles and I would love to see that continue. Many traders will read YOUR posts, and this will provide more intuitive discussions between all of YOU! Wouldn't it be nice to network with others out there? Keep trying to do your part. Please post anything you would like. Just remember that when you do post a comment, if it happens to be a question directed to me, send an e-mail instead. I do not have a "reply" function to your posts.

Here is the article I finished today. If you trade credit spreads on Price Pattern breakouts, then it is right up your alley. I'll post later...for right now I need to prep for the Credit Spreads trading room!!!

Here it is...

Weekly Market Commentary 8-17-2006
Jeff Kohler
PHD Coach / Trading Rooms Instructor

A week of good news has helped to put a few pieces of the puzzle together for investors. We have seen a variety of positive news events this week. A few events included an extinguished terrorist threat, a cease-fire agreement in the middle-east, and positive Consumer Price Index and Producer Price Index results. This has provided temporary relief to traders about the warning the Fed has given about inflation, and has provided a nice drop in the price of oil. While this may look like a short term bullish circumstance, has this really changed the overall conditions of the economy?

Martin Pring, the author of Technical Analysis Explained states “As in a court of law, a trend is presumed innocent until proven guilty.” We can relate this to the market in two ways. First, the S&P 500 has started an uptrend in the short term. This ought to provide short term traders opportunity to profit on bullish movements until this trend changes. Second, in terms of the bigger picture we are still well below prior highs from earlier in the year. If you look at a 5-year chart you can see that if a lower high is established, this can help illustrate a continued bear market. Going back to Martin Pring’s statement, we need to respect this trend until we are provided something otherwise.

Despite market alterations, as a trader you must always be ready to adapt to changes and willing to modify strategies in order to reach that common goal we share of being a productive trader. The question remains “What Works, and Why?” This week we are going to discuss a strategy that many INVESTools students have used through these last few months called a Bull Put Spread. Since the current of the market is traveling in an upward direction at the moment, this trade will profit on rising prices while offering limited risk and a high probability of reward. To illustrate this example look at the chart below of Research in Motion (RIMM).

RIMM confirmed a trend reversal signal called a “Double Bottom” almost a week ago. A double bottom is a significant signal in a downtrending stock. A downtrending stock will make lower “highs” and lower “lows.” When most stocks have reached the end of this downtrend they will fail to make a lower “low,” and this is when a support level or “bottom” forms. As you can see in the chart, RIMM found a bottom near $62. This alone does not mean we take a bullish trade, but when the stock confirms a higher “high,” this is when you haven confirmed a reversal in the trend. When RIMM broke our signal price of $72 accompanied with heavy volume, this is a great opportunity to enter a bull put spread. Here is an example of a trade entered on 8/10/06, the day of the breakout.

Buy September 65 Put @ $0.70
Sell September 70 Put @ $2.80

This trade resulted in a credit of $2.10 to the account. Why does this trade work? The reason this works is that this is a high probability trade. Our probability is based on the fact that this break of resistance at $72 will now act as new support for the stock to fall back on (theoretically). As long as the stock stays above $70 (which is the strike of the put we sold), then the investor will walk away from this trade realizing 100% of the credit paid. It is a good idea to pick a strike price in this trade that the stock price is unlikely to hit. One last advantage to this trade is the fixed level of risk it offers. In this trade the worst loss we can take is $2.90. This is the difference between the strike prices minus the credit paid.

Many INVESTools students are finding success in this market trading this strategy. Many are able to outperform the market while mitigating their risk. INVESTools encourages its student base to participate in strategies like this that offer consistent returns, high probability of success, and offers low risk. You can learn more about this strategy by participating in my Advanced Options Trading Rooms session every Thursday evening at 8 p.m. Eastern.

8/16/2006

That's Right! MasterTalk tonight. I have an interesting quote tonight that I am going to use by Mark Weinstein. It goes as follows...

“The biggest mistake I made was having a specific target of what I wanted out of the trade. I think there are a lot of people in this business who just enjoy watching others lose money. I don't believe anyone ever gets wiped out in the market because of bad luck; there is always some other reason for it. Either you were off when you did the trade, or you didn't have the experience. There is always a mistake involved. I have found that the greatest traders are the ones who are most afraid of the markets. Don't get too complacent once you have made profits. The toughest thing in the world is holding on to profits. You have to learn how to lose; it is more important than learning how to win. Limit losses quickly. Most traders hold on to their losses too long because they hope the loss will not get larger. They take profits too soon, because they fear the profit will diminish. Instead, traders should fear a larger loss and hope for a larger profit.”

Similar to what we normally discuss, however he takes a stab at having a profit target, which hasn't really been put into words before. Is it bad to have target prices? If we didn't use them, how do we know when to get out with a profit???

My emphasis tonight will be triangles and how to read/trade them. I'm not posting the trades yet, since I will need that to lure you in to listening tonight.

See you tonight!!!


...I'M AN OPTION ADDICT...I'M AN OPTION ADDICT...I'M AN OPTION ADDICT... ...I'M AN OPTION ADDICT...I'M AN OPTION ADDICT...I'M AN OPTION ADDICT...

About me

  • I'm Option Addict
  • From Saratoga Springs, Utah, United States
  • I am a professional trader and an instructor for Investools. I've had relations with the markets for 9 years. Born in Concord, CA, but reside in Saratoga Springs, Utah. Father of THREE, Husband of one.
My profile

Prescriptions Here!

Other stuff

Blogarama - 
The Blog Directory
Directory of 
Finance/Business Blogs Finance 
blogs Top Blogs Finance Blogs - BlogCatalog Blog Directory